Wards of FAIR Ordinance Sponsors Have Far Fewer Renters, but Similar Rent Burdens
Summary
- Chicago is considering two ordinances that would overhaul landlord-tenant regulation. The Protecting Renters Ordinance (PRO) is supported by the mayor and a variety of tenant advocacy groups. The Fair and Accountable Illinois Rental (FAIR) Ordinance is supported by landlord groups.
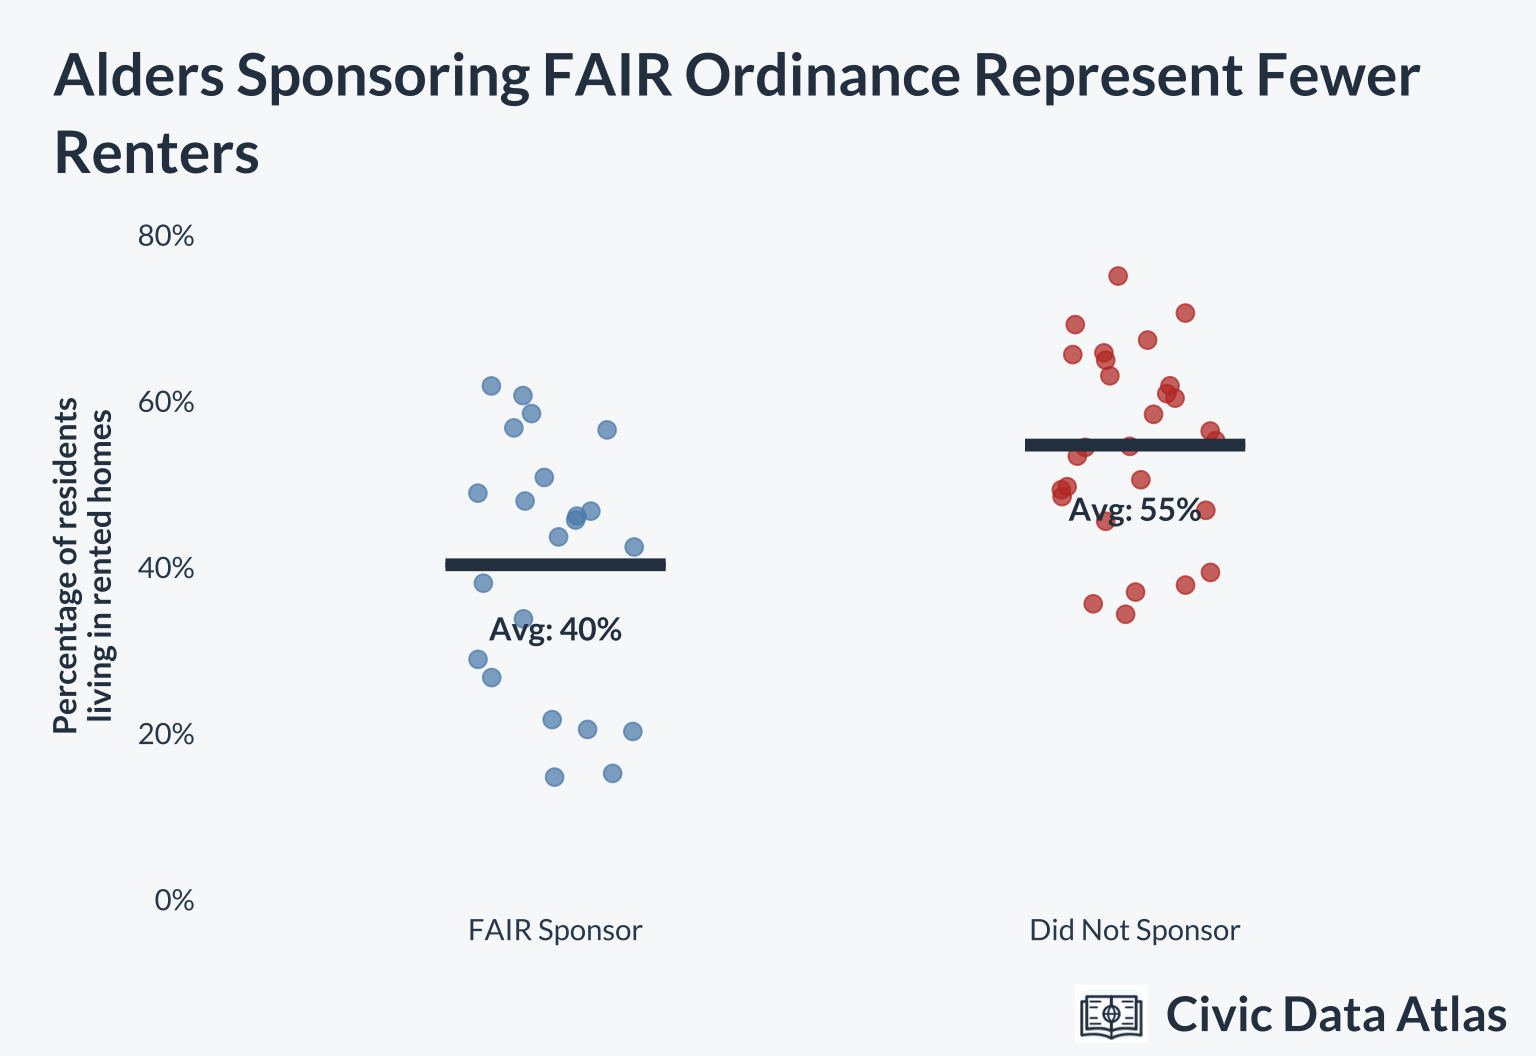
- In the average ward whose alderperson sponsored the FAIR ordinance, 40% of residents live in renter-occupied housing, compared with 55% in the average ward whose alderperson did not sponsor it.
- Renters in FAIR sponsors’ wards are about as likely to be rent burdened as renters elsewhere: about half spend 30% or more of their income on rent and utilities, and about one in four spend 50% or more.
This summer, Chicago Mayor Brandon Johnson introduced a sweeping rewrite of landlord-tenant regulations called the Protecting Renters Ordinance (PRO). PRO is supported by an assortment of tenant advocacy organizations, who describe it as a badly needed update to the city’s landlord-tenant rules, which date to 1986. PRO would create a new Bureau of Rental Housing Services, funded by fees paid by landlords, and a landlord registry, and would ban move-in and move-out fees, among other changes.
Some alders and landlord groups objected to PRO. Opponents warn that additional fees and regulatory burdens on landlords will deter new housing production, ultimately increasing rents.
Their alternative is the Fair and Accountable Illinois Rental (FAIR) Ordinance, which landlord groups are supporting. As currently written, the FAIR ordinance would not create a new Bureau of Rental Housing Services or impose new fees on landlords. (A full accounting of the differences between the ordinances is beyond the scope of this piece.)
Since PRO was introduced, commentators have speculated that alders who represent a higher share of renters might be more inclined to vote for PRO. So far, FAIR and PRO have received votes from a subset of alders in committee hearings, so council votes can’t yet show who supports which ordinance. But FAIR has 22 sponsors and co-sponsors, so we can compare the constituencies of FAIR supporters with the rest of the city.1
Using Civic Data Atlas data, FAIR sponsors represent fewer renters than other alders: on average, 40% of residents in the wards of FAIR sponsors are renters, compared with 55% in the rest of the city.
While FAIR supporters have fewer renting constituents on average, there are several alders with a high share of renting constituents who have sponsored FAIR, including Bennett Lawson (44th Ward, 62% renters), Brendan Reilly (42nd Ward, 61% renters), Gregory Mitchell (7th Ward, 59% renters) and Brian Hopkins (2nd Ward, 57% renters). By comparison, all the wards dominated by homeowners have co-sponsored FAIR.
What about rental costs? Are the renting constituents of FAIR sponsors less likely to be rent burdened than renters in other areas of the city? To compare wards with different income levels, we use rent and utility costs as a percentage of household income, counting renters who spend 30% or more as rent burdened and 50% or more as severely rent burdened.2
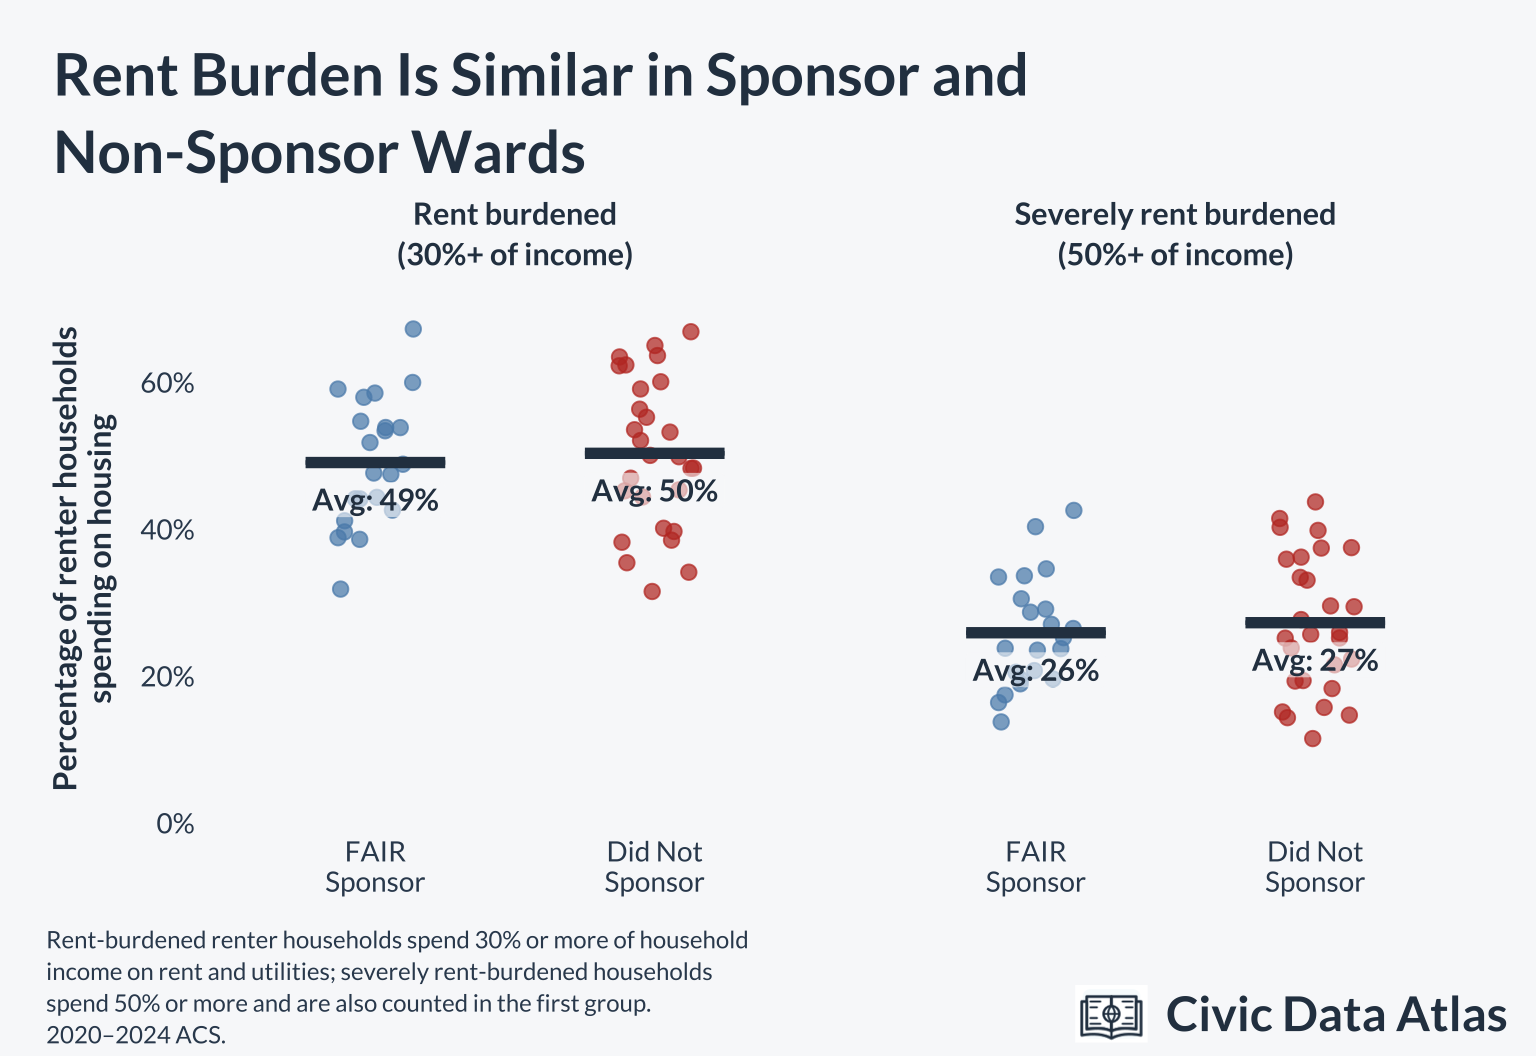
High rents relative to incomes are a similar problem in wards represented by FAIR sponsors and by non-sponsors. On average, about half of renters spend 30% or more of their income on rent and utilities, while about one in four spend 50% or more.
Data Appendix
| Ward | Alder | % of residents who rent | % of renters rent burdened (30%+) | % of renters severely rent burdened (50%+) | FAIR sponsor |
|---|---|---|---|---|---|
| Ward 1 | Daniel La Spata | 55% | 32% | 12% | No |
| Ward 2 | Brian Hopkins | 57% | 44% | 21% | Yes |
| Ward 3 | Pat Dowell | 57% | 54% | 24% | Yes |
| Ward 4 | Lamont J. Robinson | 65% | 52% | 28% | No |
| Ward 5 | Desmon C. Yancy | 66% | 56% | 33% | No |
| Ward 6 | William E. Hall | 56% | 67% | 38% | No |
| Ward 7 | Gregory Mitchell | 59% | 58% | 34% | Yes |
| Ward 8 | Michelle Harris | 49% | 59% | 34% | Yes |
| Ward 9 | Anthony Beale | 42% | 67% | 43% | Yes |
| Ward 10 | Peter Chico | 46% | 54% | 35% | Yes |
| Ward 11 | Nicole T. Lee | 44% | 44% | 24% | Yes |
| Ward 12 | Julia M. Ramirez | 38% | 45% | 26% | No |
| Ward 13 | Marty Quinn | 20% | 60% | 27% | Yes |
| Ward 14 | Jeylu B. Gutierrez | 36% | 54% | 19% | No |
| Ward 15 | Raymond Lopez | 48% | 55% | 31% | Yes |
| Ward 16 | Stephanie D. Coleman | 49% | 62% | 41% | No |
| Ward 17 | David Moore | 49% | 63% | 40% | No |
| Ward 18 | Derrick G. Curtis | 15% | 59% | 40% | Yes |
| Ward 19 | Matthew J. O’Shea | 15% | 49% | 25% | Yes |
| Ward 20 | Jeanette B. Taylor | 75% | 55% | 33% | No |
| Ward 21 | Ronnie L. Mosley | 37% | 65% | 44% | No |
| Ward 22 | Michael D. Rodriguez | 39% | 48% | 22% | No |
| Ward 23 | Silvana Tabares | 22% | 48% | 21% | Yes |
| Ward 24 | Monique L. Scott | 69% | 62% | 36% | No |
| Ward 25 | Byron Sigcho Lopez | 60% | 40% | 22% | No |
| Ward 26 | Jessica Fuentes | 55% | 48% | 29% | No |
| Ward 27 | Walter Redmond Burnett | 66% | 45% | 25% | No |
| Ward 28 | Jason C. Ervin | 67% | 60% | 37% | No |
| Ward 29 | Chris Taliaferro | 46% | 59% | 36% | No |
| Ward 30 | Ruth Cruz | 34% | 50% | 26% | No |
| Ward 31 | Felix Cardona, Jr. | 51% | 52% | 29% | Yes |
| Ward 32 | Scott Waguespack | 38% | 32% | 14% | Yes |
| Ward 33 | Rossana Rodriguez Sanchez | 58% | 40% | 16% | No |
| Ward 34 | William Conway | 62% | 39% | 18% | No |
| Ward 35 | Anthony Quezada | 53% | 35% | 14% | No |
| Ward 36 | Gilbert Villegas | 47% | 43% | 20% | Yes |
| Ward 37 | Emma Mitts | 51% | 64% | 40% | No |
| Ward 38 | Nicholas Sposato | 21% | 48% | 27% | Yes |
| Ward 39 | Samantha Nugent | 34% | 44% | 20% | Yes |
| Ward 40 | Andre Vasquez, Jr. | 54% | 47% | 24% | No |
| Ward 41 | Anthony Napolitano | 27% | 41% | 24% | Yes |
| Ward 42 | Brendan Reilly | 61% | 39% | 19% | Yes |
| Ward 43 | Timmy Knudsen | 50% | 38% | 15% | No |
| Ward 44 | Bennett R. Lawson | 62% | 40% | 17% | Yes |
| Ward 45 | James M. Gardiner | 29% | 39% | 16% | Yes |
| Ward 46 | Angela Clay | 63% | 44% | 19% | No |
| Ward 47 | Matthew J. Martin | 47% | 34% | 15% | No |
| Ward 48 | Leni Manaa-Hoppenworth | 61% | 53% | 30% | No |
| Ward 49 | Maria E. Hadden | 71% | 50% | 25% | No |
| Ward 50 | Debra Silverstein | 46% | 53% | 29% | Yes |
Footnotes
Our prior PRO analysis compared the Progressive Caucus, whose members are expected to support PRO, with the rest of the city council.↩︎
Landlords differ in whether rent includes utilities, so to compare areas on an apples-to-apples basis we count rent and utilities together.↩︎