| Renters | Owners | |
|---|---|---|
| Share of occupied housing units | 54.0% | 46.0% |
| Share of residents in occupied housing units | 48.2% | 51.8% |
Mayor Johnson’s Protecting Renters Ordinance, by the Numbers
Who rents, where renters live, and how often renters move
Summary
- Mayor Johnson’s proposed Protecting Renters Ordinance would create several new rental protections, including a rental registry, a tenants’ rights enforcement bureau, limits on move-in and move-out fees, and new protections for renters who are not offered a lease renewal.
- Renters are concentrated downtown and along the lakefront, but every ward has a substantial renter population. About one in five Chicago renters moved in the past year, making recent movers an important group for understanding the ordinance’s potential reach.
- Chicago renters’ household incomes are less than half those of homeowners, and their poverty rate is three times higher. Across the Chicago metropolitan area, more than one in four renter households reports a severe housing-quality issue.
Mayor Brandon Johnson is planning to introduce the Protecting Renters Ordinance, a proposal that would make several major updates to Chicago’s rental protection measures. Among other changes, the proposal would establish a rental registry to give the city better data on the stock of rental housing and create a new enforcement bureau to protect tenants’ rights. It would also ban move-in and move-out fees and add new protections for renters who are not offered a lease renewal.
The ordinance would apply broadly to Chicago’s rental housing market, but renters are not evenly distributed across the city. To understand who the proposal would most directly affect, it helps to start with the citywide renter population. A majority of Chicago households rent, but owner-occupied households are larger — so homeowners are a slim majority of residents overall.
Source: American Community Survey 2020-2024.
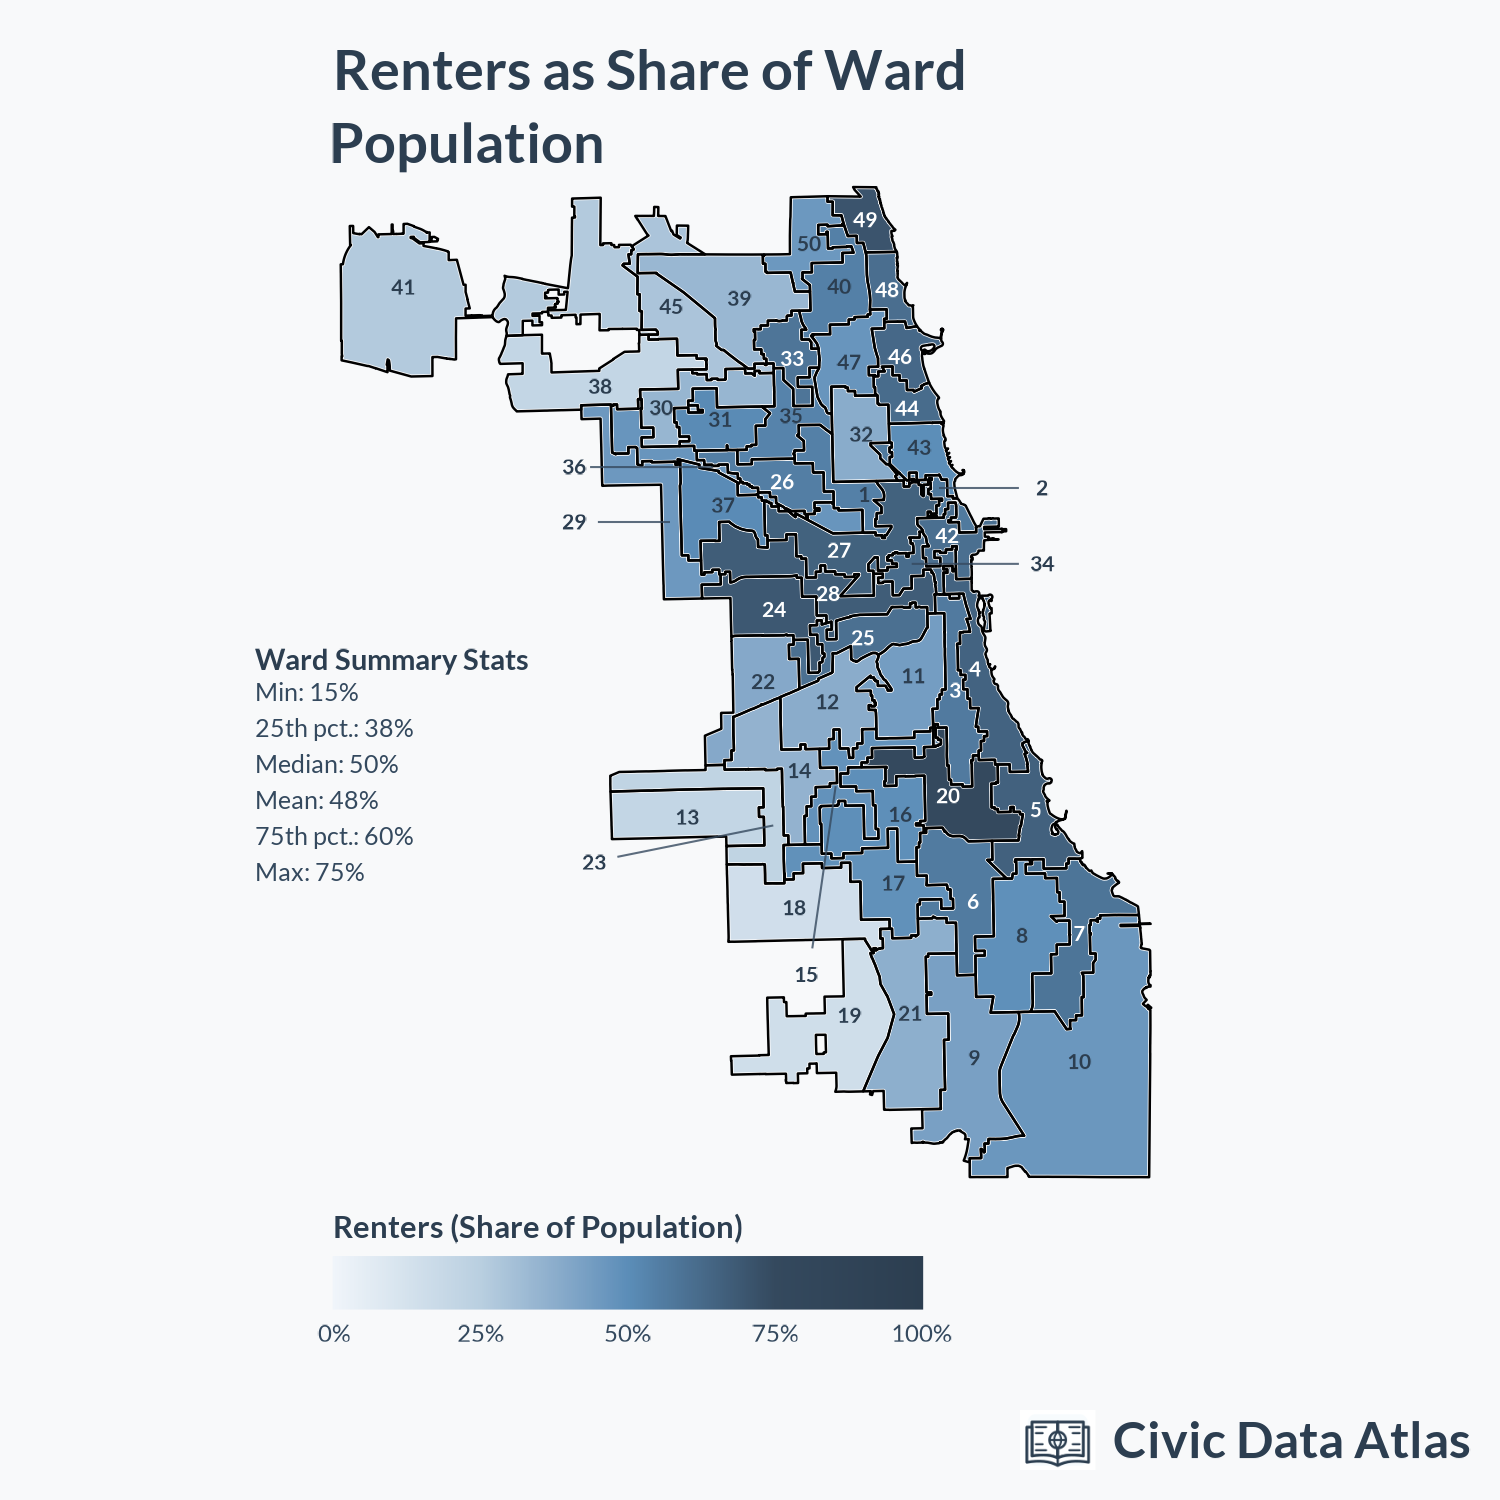
The politics of the ordinance will also depend on where renters live. As the Chicago Tribune reported, “Johnson will need to win over moderate aldermen, potentially in areas with a high density of renters, while securing broad support from City Council progressives.” The map below uses Civic Data Atlas ward-level data to show the percentage of residents who are renters in each ward. The highest concentrations of renters are downtown and in the lakefront wards. The far Southeast Side and Southwest Side wards have lower shares of renters, but even the city’s most owner-dominated wards have a substantial renter population. Specific ward-by-ward figures are available on Civic Data Atlas’ compare all wards page, as well as the bottom of this article.
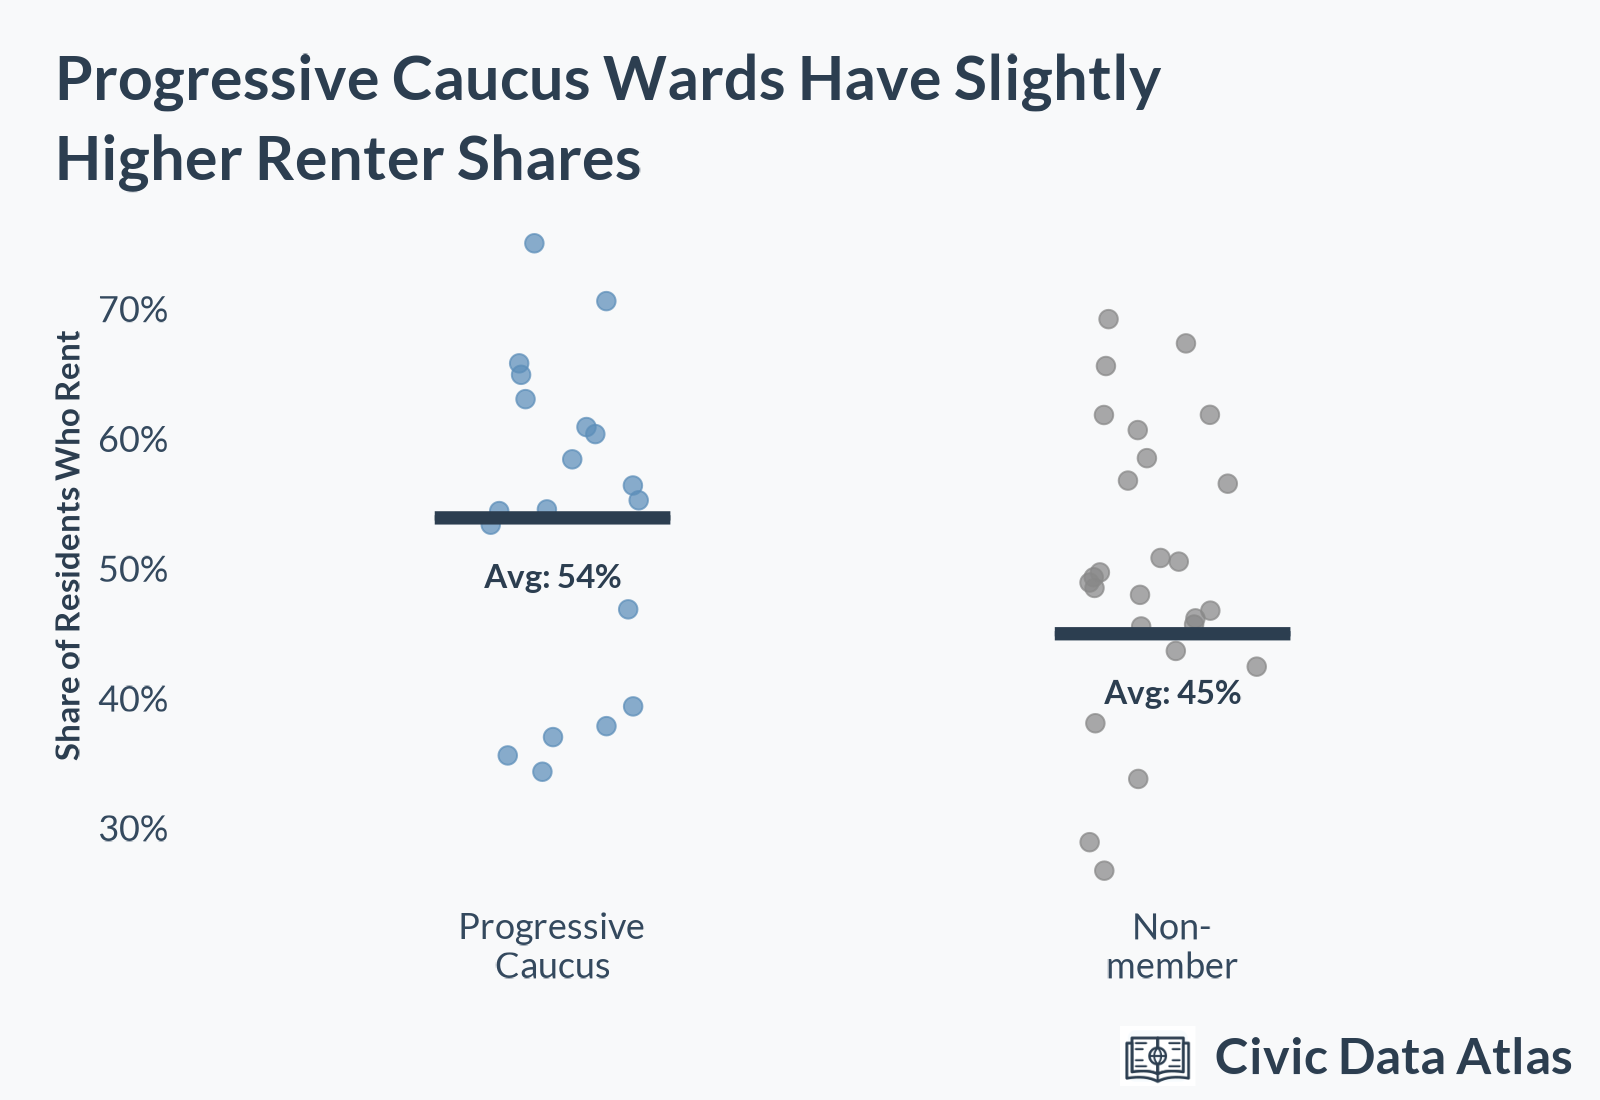
That geography does not map neatly onto the City Council’s ideological blocs. Progressive Caucus members do represent somewhat more renter-heavy wards than the rest of the City Council, but the difference is not dramatic. Many renter-heavy wards are not represented by Progressive Caucus members, and several Progressive Caucus members represent wards where renters are a minority of residents.1
Ward-level politics are only one part of the story. At the household level, Chicago renters are economically and demographically distinct from homeowners. Median household income for renters is less than half that of owner-occupied households, and the renter poverty rate is three times higher. Renters are more likely to be Black and less likely to be white, while Chicago’s Hispanic and Asian residents are about as likely to rent as they are to own.
| All Chicago | Owners | Renters | |
|---|---|---|---|
| % of Chicago population | 100% | 52.2% | 47.8% |
| Median household income (2024$) | $93,400 | $128,300 | $60,900 |
| % below poverty line | 16.6% | 7.9% | 26.2% |
| % White (non-Hispanic) | 32.0% | 36.2% | 27.4% |
| % Black or African American | 27.3% | 21.2% | 34.0% |
| % Hispanic or Latino | 30.0% | 31.6% | 28.2% |
| % Asian | 7.2% | 7.5% | 6.8% |
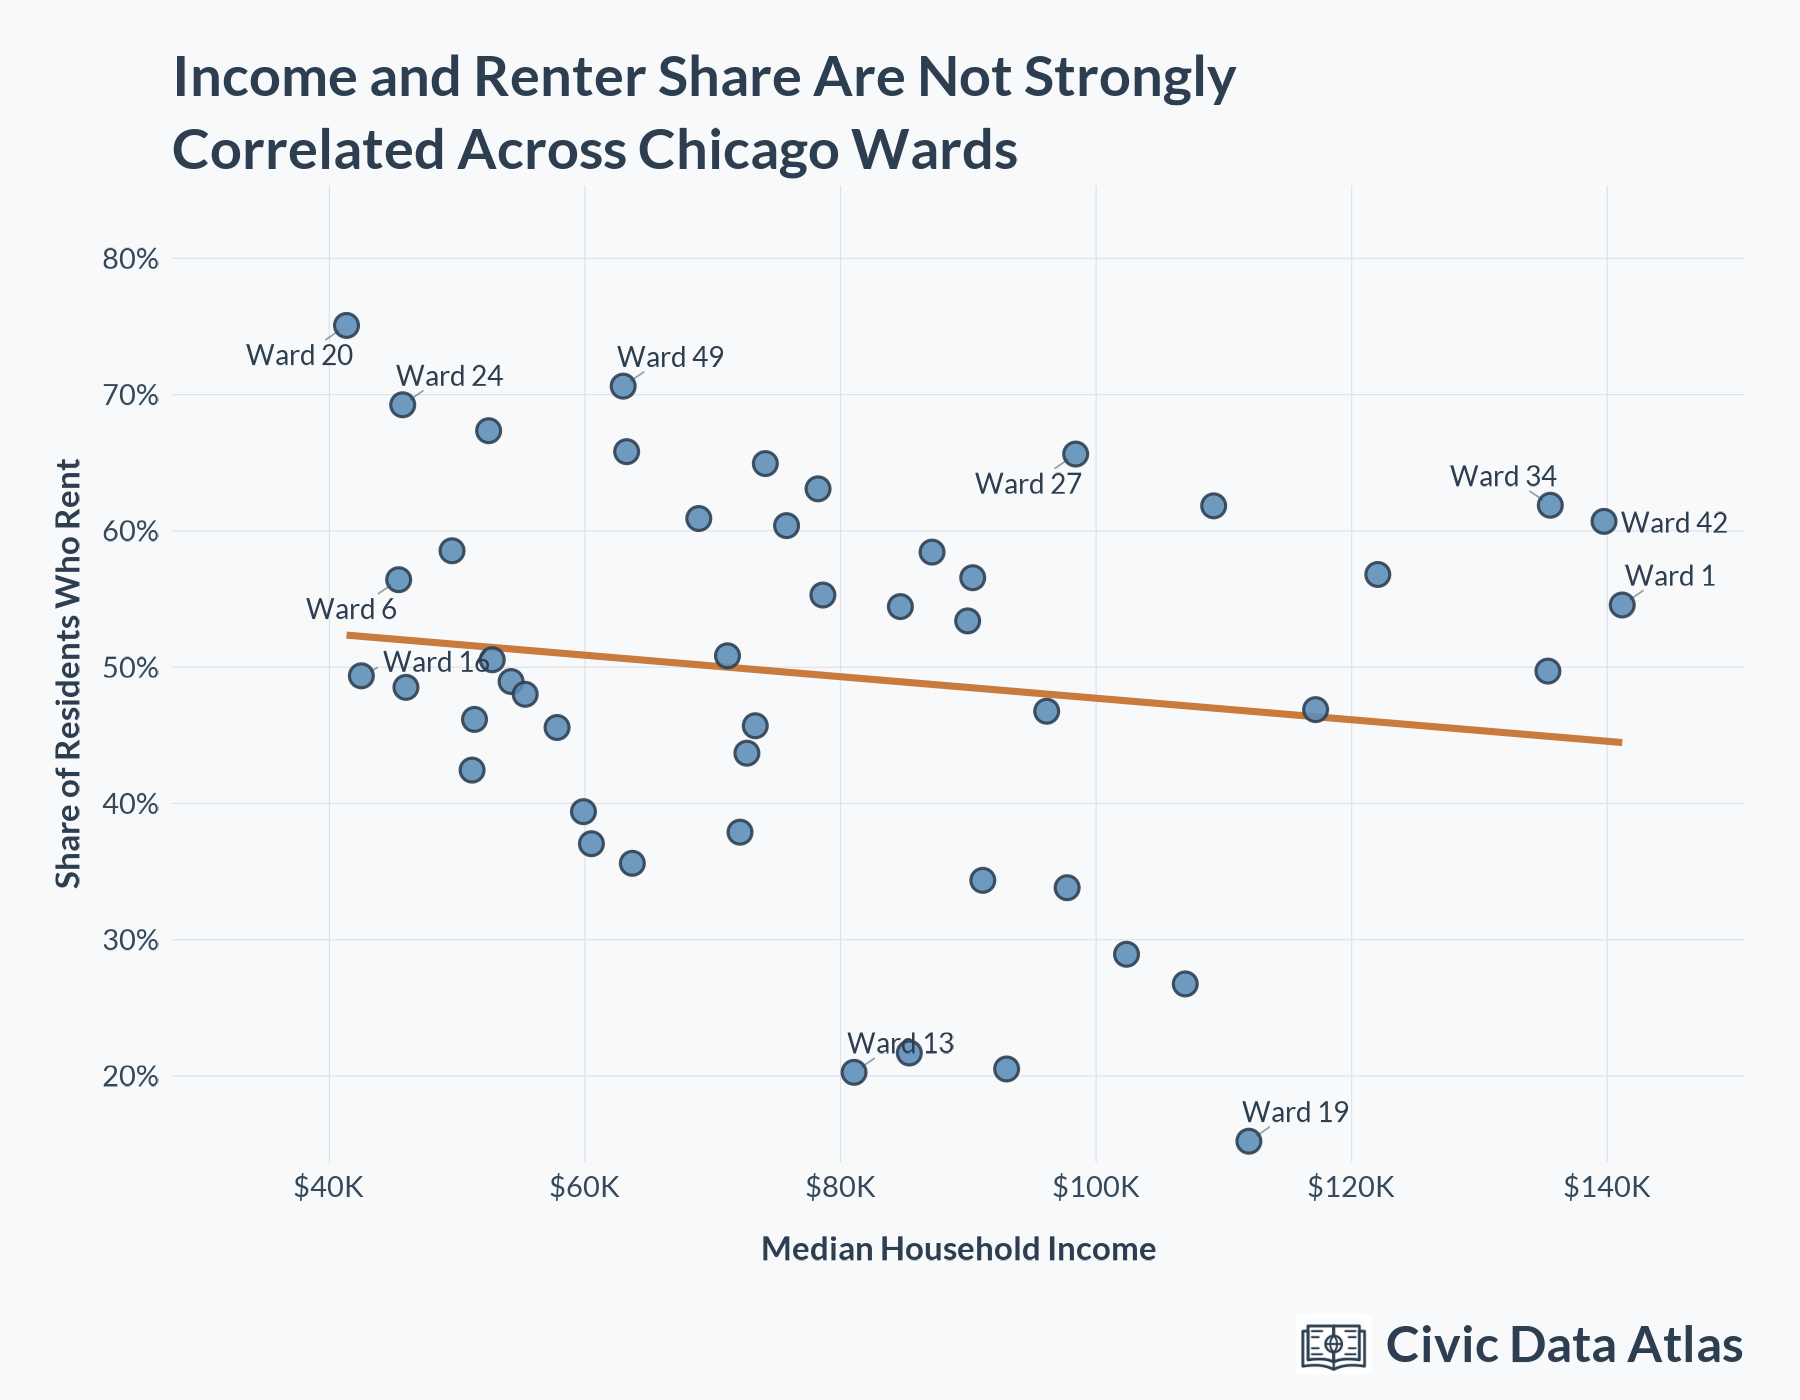
These household-level differences do not translate neatly into ward-level patterns. Despite the strong relationship between income and renter status among households, there is little correlation between a ward’s renter share and its median household income. Wealthy wards such as Ward 1, which includes West Town and Logan Square, and Ward 42, which includes the Near North Side and the Loop, have very high renter shares. Meanwhile, some lower-income wards, such as Ward 21, which includes Auburn Gresham and Washington Heights, are mostly composed of owner-occupied households.
Renter Mobility
The ordinance would ban nonrefundable move-in and move-out fees, which are common in Chicago rental housing. It would also strengthen protections for tenants who are forced to move after their lease is not renewed.
One way to gauge the reach of those provisions is to look at renter mobility. About one in five Chicago renters move in any given year — roughly 10% of the city’s total population. Renters who have recently moved have slightly higher incomes, lower poverty rates, and are more likely to be white than the average Chicago renter.
| All Renters | Moved <= 1 Year | |
|---|---|---|
| % of all renters | 100% | 20.5% |
| Median household income (2024$) | $60,900 | $69,200 |
| % below poverty line | 26.2% | 24.8% |
| Average gross rent | $1,630 | $1,990 |
| % White (non-Hispanic) | 27.4% | 41.0% |
| % Black or African American | 34.0% | 24.1% |
| % Hispanic or Latino | 28.2% | 19.7% |
| % Asian | 6.8% | 10.7% |
Recent renter mobility is mostly local: about two-thirds of renter households that moved in the past year came from elsewhere within Cook County, the most specific origin available in the data. Roughly one in five arrived from another state, while smaller shares came from abroad or from elsewhere in Illinois.
| Lived one year ago | Share of Movers |
|---|---|
| Within Cook County | 67.6% |
| Another U.S. state | 19.1% |
| From abroad | 7.8% |
| Elsewhere in Illinois | 5.4% |
Housing Quality Problems for Renters
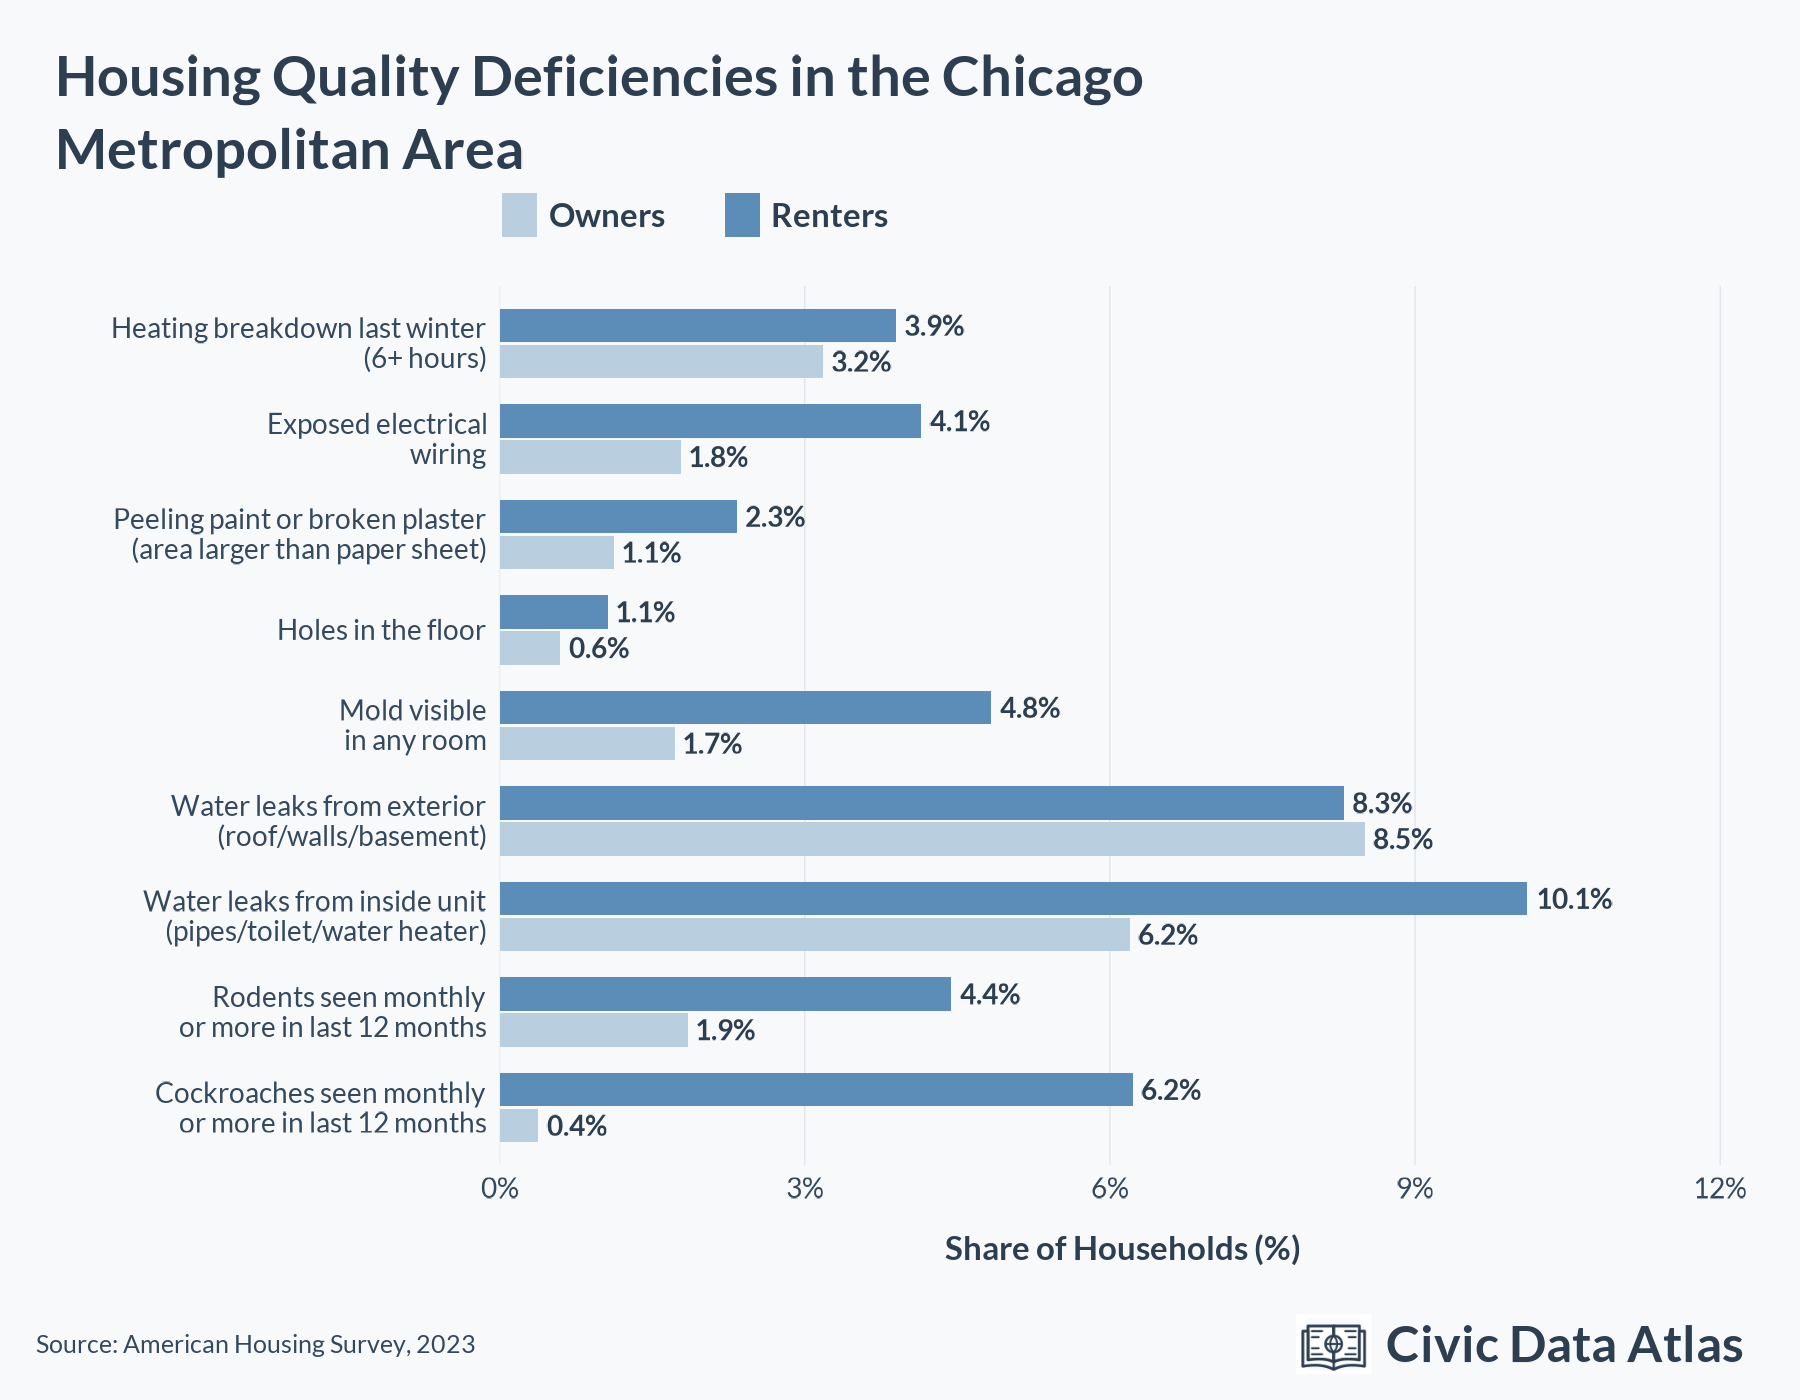
One of the justifications for the renter ordinance is to better enforce housing laws, especially against landlords who do a poor job of maintaining their units. How common are housing quality problems among Chicago renters?
Unfortunately, there is little detailed Chicago-specific housing quality data available. However, we can use the U.S. Census Bureau’s American Housing Survey for the Chicago metropolitan area (which includes Chicago suburbs) to get a sense of how frequently various housing quality problems occur — graphed below. While no single housing issue is particularly common, over one in four renters have dealt with at least one of the quality issues listed. Almost all types of issues are far more common among renters than among homeowners.
Ward-Level Statistics
| Ward | Current alder | Renters (share of population) | Renters who moved in the past year (share of population) |
|---|---|---|---|
| 1 | Daniel La Spata | 54.6% | 16.5% |
| 2 | Brian Hopkins | 56.8% | 22.0% |
| 3 | Pat Dowell | 56.6% | 11.1% |
| 4 | Lamont J. Robinson | 64.9% | 17.0% |
| 5 | Desmon C. Yancy | 65.8% | 15.4% |
| 6 | William E. Hall | 56.4% | 8.6% |
| 7 | Gregory I. Mitchell | 58.5% | 8.9% |
| 8 | Michelle A. Harris | 48.9% | 7.0% |
| 9 | Anthony Beale | 42.4% | 4.2% |
| 10 | Peter Chico | 46.2% | 3.9% |
| 11 | Nicole T. Lee | 43.7% | 7.4% |
| 12 | Julia M. Ramirez | 37.9% | 2.6% |
| 13 | Marty Quinn | 20.3% | 1.2% |
| 14 | Jeylu B. Gutierrez | 35.6% | 1.7% |
| 15 | Raymond A. Lopez | 48.0% | 6.4% |
| 16 | Stephanie D. Coleman | 49.4% | 6.3% |
| 17 | David H. Moore | 48.5% | 6.9% |
| 18 | Derrick G. Curtis | 14.8% | 1.2% |
| 19 | Matthew J. O’Shea | 15.2% | 1.1% |
| 20 | Jeanette B. Taylor | 75.1% | 12.6% |
| 21 | Ronnie L. Mosley | 37.0% | 3.9% |
| 22 | Michael D. Rodriguez | 39.4% | 1.1% |
| 23 | Silvana Tabares | 21.7% | 1.5% |
| 24 | Monique L. Scott | 69.3% | 6.8% |
| 25 | Byron Sigcho-Lopez | 60.4% | 10.0% |
| 26 | Jessica L. Fuentes | 55.3% | 10.4% |
| 27 | Walter Burnett Jr. | 65.6% | 15.6% |
| 28 | Jason C. Ervin | 67.4% | 10.9% |
| 29 | Chris Taliaferro | 45.6% | 7.6% |
| 30 | Ruth Cruz | 34.4% | 5.1% |
| 31 | Felix Cardona Jr. | 50.8% | 6.0% |
| 32 | Scott Waguespack | 38.1% | 12.6% |
| 33 | Rossana Rodriguez Sanchez | 58.4% | 10.7% |
| 34 | William Conway | 61.9% | 26.9% |
| 35 | Anthony J. Quezada | 53.4% | 11.3% |
| 36 | Gilbert Villegas | 46.8% | 8.6% |
| 37 | Emma Mitts | 50.5% | 6.0% |
| 38 | Nicholas Sposato | 20.5% | 2.6% |
| 39 | Samantha Nugent | 33.8% | 4.4% |
| 40 | Andre Vasquez Jr. | 54.4% | 11.7% |
| 41 | Anthony V. Napolitano | 26.8% | 5.2% |
| 42 | Brendan Reilly | 60.7% | 26.0% |
| 43 | Timothy R. Knudsen | 49.7% | 19.7% |
| 44 | Bennett R. Lawson | 61.8% | 25.2% |
| 45 | James M. Gardiner | 28.9% | 4.6% |
| 46 | Angela Clay | 63.1% | 18.7% |
| 47 | Matthew J. Martin | 46.9% | 13.1% |
| 48 | Leni Manaa-Hoppenworth | 60.9% | 12.9% |
| 49 | Maria E. Hadden | 70.6% | 17.7% |
| 50 | Debra L. Silverstein | 45.7% | 7.4% |
Footnotes
Progressive Caucus members include: Daniel La Spata (1), Lamont Robinson (4), Desmon Yancy (5), William Hall (6), Julia Ramirez (12), Jeylú Gutiérrez (14), Jeanette Taylor (20), Ronnie Mosley (21), Michael Rodriguez (22), Byron Sigcho-Lopez (25), Jessie Fuentes (26), Ruth Cruz (30), Rossana Rodriguez-Sanchez (33), Anthony Quezada (35), Andre Vasquez (40), Angela Clay (46), Matt Martin (47), Leni Manaa-Hoppenworth (48), and Maria Hadden (49).↩︎