Air Conditioning Access and Heat Vulnerability in Chicago
Air Conditioning and Heat Vulnerability Estimates for Chicago’s 77 Community Areas
Summary
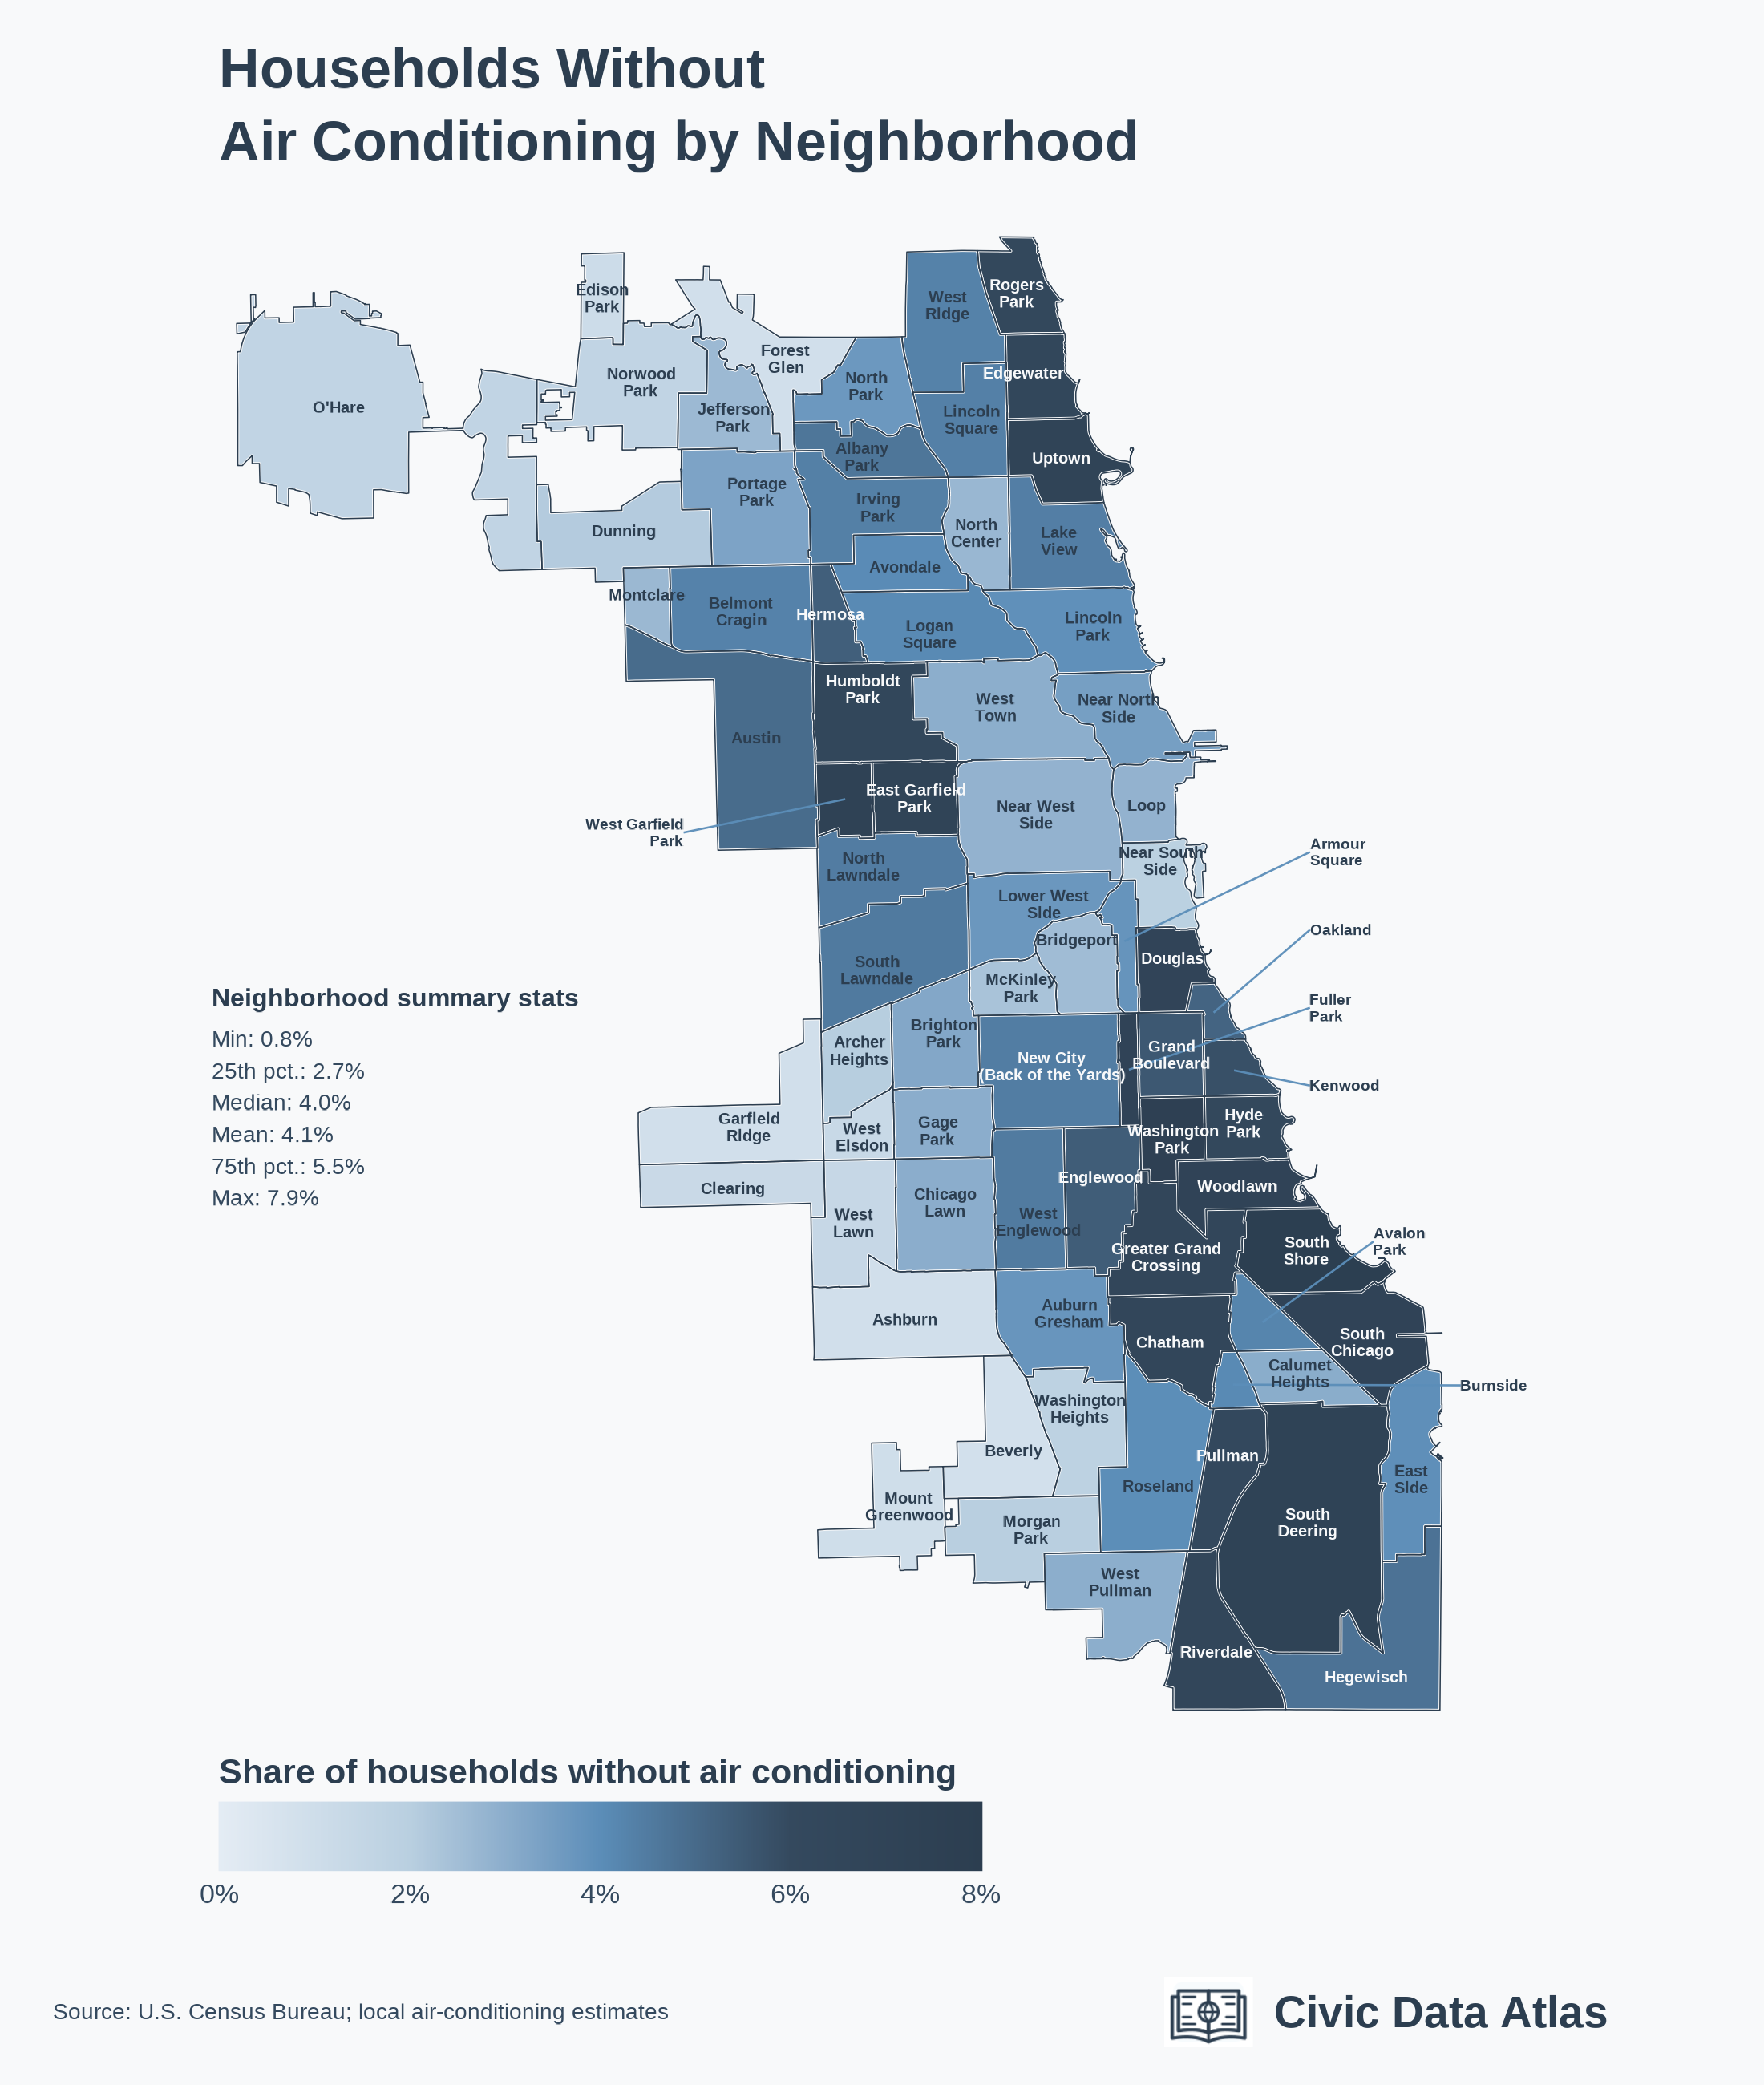
- According to U.S. Census estimates, about 50,000 Chicago households lack air conditioning, or 4% of households citywide.
- Neighborhoods on the South Side, West Side, and far North Side lakefront have some of the highest shares of households without AC.
- A separate Census heat-vulnerability measure shows the highest combined heat risks concentrated on the South Side.
As Chicago faces its first major heat wave of the summer, new U.S. Census data shows 4% of Chicago households lack air conditioning.
Air conditioning access varies sharply by neighborhood.1 Households without AC are more concentrated on the South Side, parts of the West Side, and in far North Side lakefront communities. In those areas, 7% to 8% of households do not have air conditioning. In some wealthier downtown and suburban neighborhoods, less than 2% of households are without AC.
Heat Vulnerability
Air conditioning access is one of the clearest indicators of heat risk, but it is not the only factor that makes people vulnerable to extreme heat. People without access to a car may face more heat exposure while commuting or running errands. Older adults are more vulnerable because the body generally becomes less able to regulate heat with age. Lower-income households, even when they have AC, may be unable to use it because of cost; according to CDC data, almost 12% of Chicago residents were threatened with utility shutoff in the last year.
The U.S. Census Bureau combines these kinds of risk factors into an estimate of community vulnerability to extreme heat. The maps below show the share of residents in each neighborhood with three or more of eleven heat-vulnerability risk factors, the highest category of vulnerability tracked.
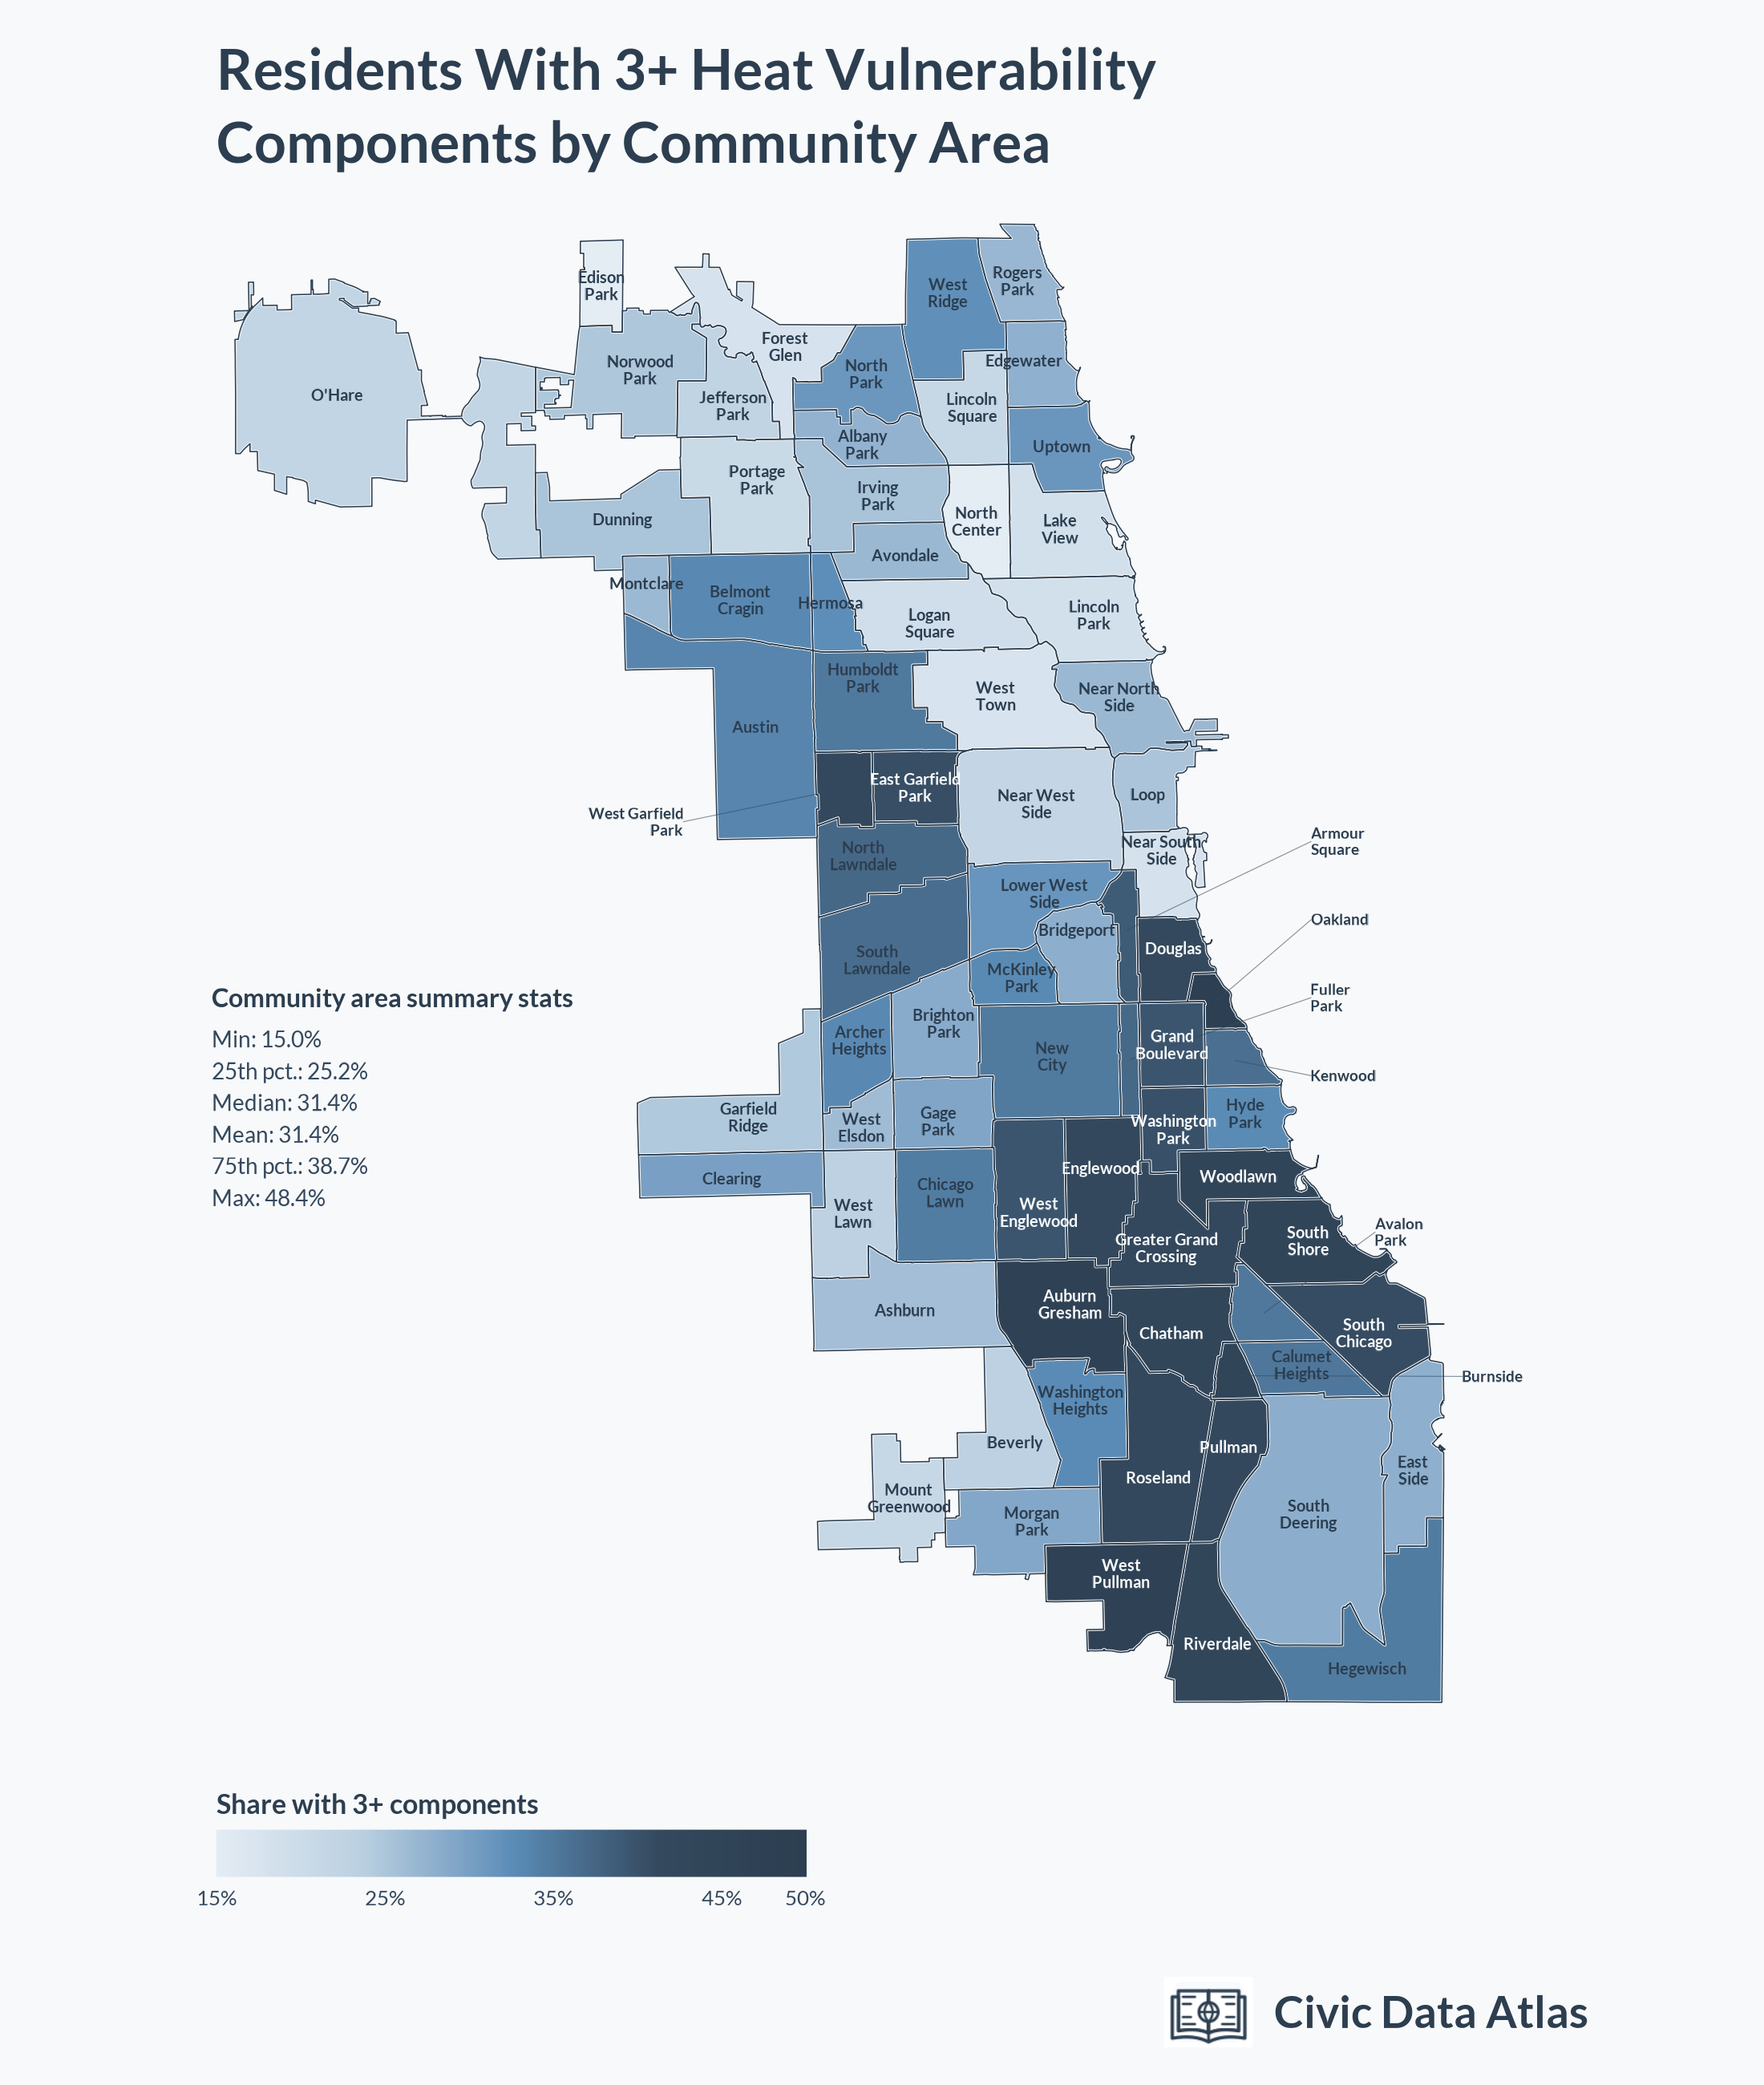
The Census heat-vulnerability map broadly tracks the share of households estimated to lack AC. However, the highest overall heat vulnerability is more concentrated on the South Side than lack of AC alone: the 10 community areas with the highest shares of residents in the top heat-vulnerability category are all on the South Side, where more than 40% of residents have at least three risk factors. Far North Side lakefront neighborhoods with low rates of AC access are notably less vulnerable on other dimensions. For instance, an estimated 6.9% of households in Uptown do not have air conditioning, while 31.3% of residents have three or more heat risk factors. In contrast, Woodlawn has about the same rate of households lacking AC (7.1%) but much higher heat vulnerability (44.1% of residents with three or more risk factors).
Additional Data
The table below gives the underlying estimates for every community area. Click any column header to sort.
| Albany Park | 4.7% | 27.6% |
| Archer Heights | 2.0% | 32.9% |
| Armour Square | 3.8% | 38.7% |
| Ashburn | 0.9% | 25.9% |
| Auburn Gresham | 3.7% | 46.8% |
| Austin | 4.9% | 33.4% |
| Avalon Park | 4.2% | 35.2% |
| Avondale | 4.0% | 26.8% |
| Belmont Cragin | 4.3% | 33.0% |
| Beverly | 0.8% | 23.0% |
| Bridgeport | 2.5% | 28.0% |
| Brighton Park | 3.2% | 28.4% |
| Burnside | 4.1% | 44.6% |
| Calumet Heights | 3.0% | 35.2% |
| Chatham | 6.6% | 43.6% |
| Chicago Lawn | 3.0% | 34.5% |
| Clearing | 1.3% | 29.9% |
| Douglas | 6.9% | 41.6% |
| Dunning | 2.1% | 25.2% |
| East Garfield Park | 6.9% | 40.6% |
| East Side | 3.9% | 27.9% |
| Edgewater | 6.4% | 27.8% |
| Edison Park | 1.1% | 15.0% |
| Englewood | 5.4% | 42.4% |
| Forest Glen | 0.9% | 17.9% |
| Fuller Park | 7.0% | 37.0% |
| Gage Park | 3.0% | 29.2% |
| Garfield Ridge | 0.9% | 24.5% |
| Grand Boulevard | 5.5% | 39.6% |
| Greater Grand Crossing | 6.6% | 42.1% |
| Hegewisch | 4.8% | 34.6% |
| Hermosa | 5.3% | 32.3% |
| Humboldt Park | 6.4% | 34.9% |
| Hyde Park | 6.3% | 32.7% |
| Irving Park | 4.4% | 25.3% |
| Jefferson Park | 2.6% | 22.1% |
| Kenwood | 5.8% | 36.2% |
| Lake View | 4.4% | 18.6% |
| Lincoln Park | 3.9% | 18.7% |
| Lincoln Square | 4.4% | 21.2% |
| Logan Square | 4.1% | 19.1% |
| Loop | 2.8% | 25.1% |
| Lower West Side | 3.7% | 31.4% |
| McKinley Park | 2.3% | 32.9% |
| Montclare | 2.7% | 26.5% |
| Morgan Park | 2.0% | 29.0% |
| Mount Greenwood | 1.0% | 21.2% |
| Near North Side | 3.5% | 26.8% |
| Near South Side | 1.9% | 18.0% |
| Near West Side | 2.8% | 21.6% |
| New City | 4.5% | 34.9% |
| North Center | 2.7% | 15.1% |
| North Lawndale | 4.5% | 37.1% |
| North Park | 3.7% | 31.1% |
| Norwood Park | 1.6% | 24.8% |
| O’Hare | 1.6% | 21.9% |
| Oakland | 5.2% | 48.4% |
| Portage Park | 3.3% | 20.5% |
| Pullman | 6.1% | 41.7% |
| Riverdale | 6.5% | 43.7% |
| Rogers Park | 6.2% | 26.9% |
| Roseland | 4.0% | 42.4% |
| South Chicago | 7.0% | 40.9% |
| South Deering | 7.1% | 28.1% |
| South Lawndale | 4.5% | 36.5% |
| South Shore | 7.9% | 44.1% |
| Uptown | 6.9% | 31.3% |
| Washington Heights | 1.8% | 32.7% |
| Washington Park | 7.6% | 40.2% |
| West Elsdon | 1.3% | 26.2% |
| West Englewood | 4.5% | 39.6% |
| West Garfield Park | 7.2% | 41.8% |
| West Lawn | 1.4% | 23.0% |
| West Pullman | 3.0% | 46.6% |
| West Ridge | 4.3% | 32.1% |
| West Town | 3.0% | 17.7% |
| Woodlawn | 7.1% | 44.1% |
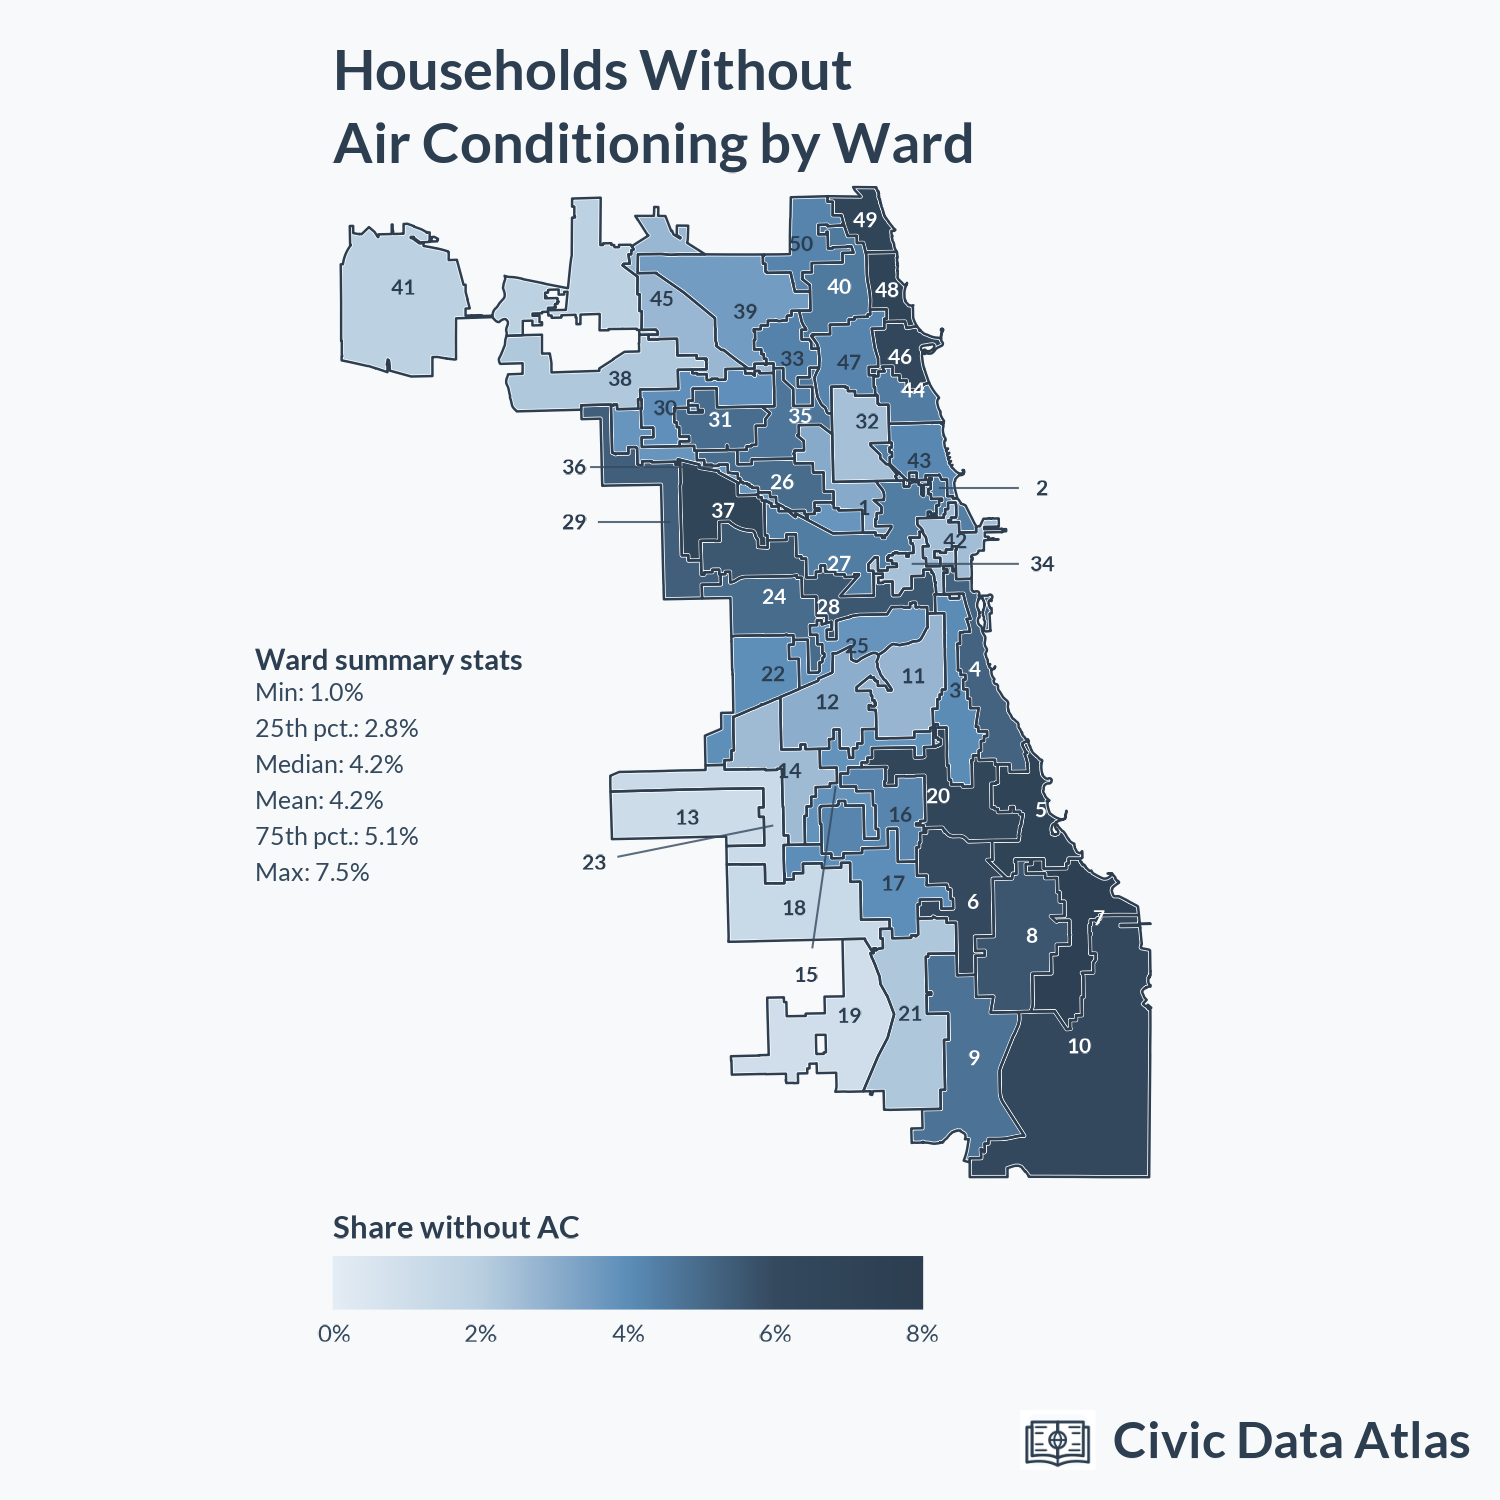
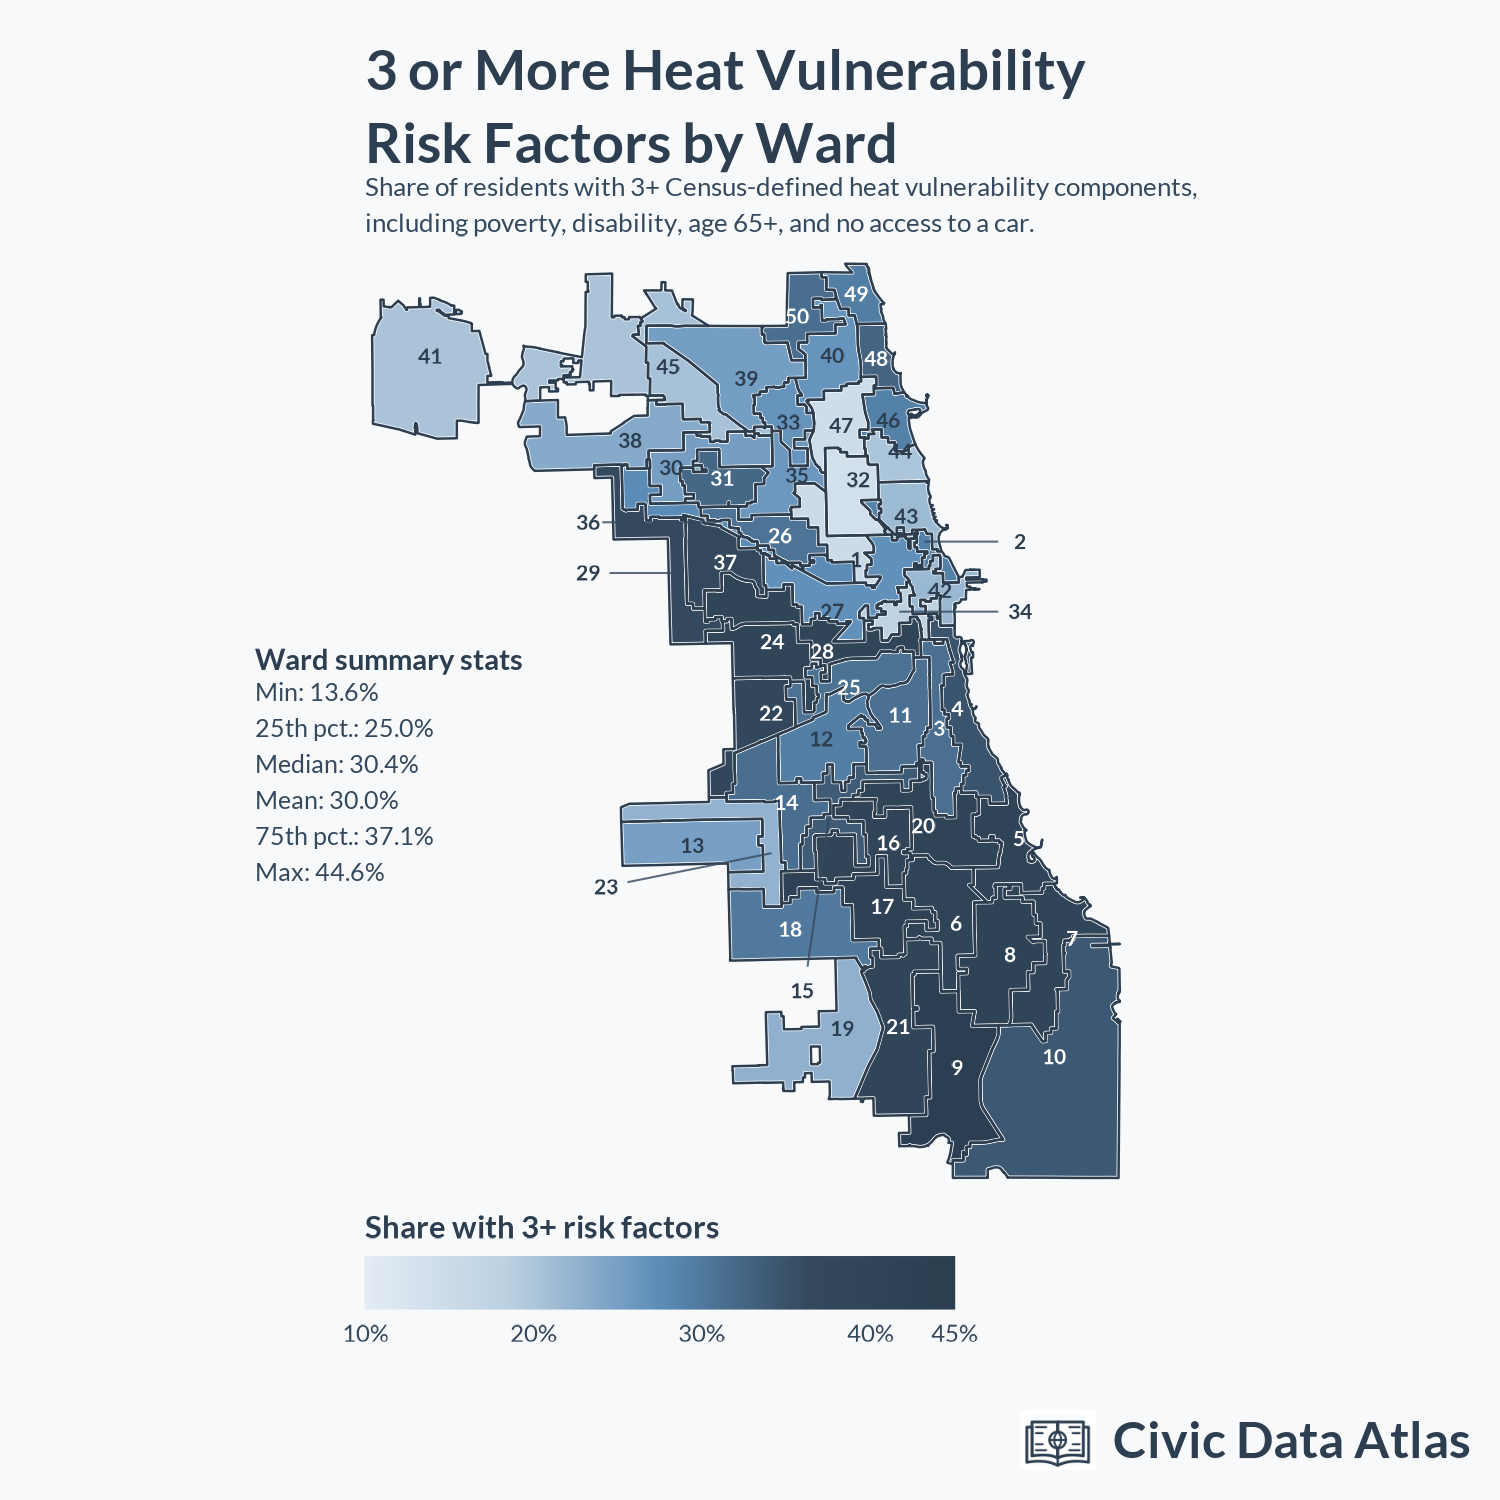
The ward maps and table below show AC access and heat vulnerability by ward. This information is also available on the main Civic Data Atlas pages.
| 1 | Daniel La Spata | 3.1% | 15.2% |
| 2 | Brian Hopkins | 4.4% | 29.0% |
| 3 | Pat Dowell | 4.0% | 31.2% |
| 4 | Lamont J. Robinson | 5.2% | 34.8% |
| 5 | Desmon C. Yancy | 6.9% | 40.5% |
| 6 | William E. Hall | 6.0% | 40.3% |
| 7 | Gregory Mitchell | 7.5% | 39.1% |
| 8 | Michelle Harris | 5.6% | 41.2% |
| 9 | Anthony Beale | 4.8% | 44.6% |
| 10 | Peter Chico | 6.2% | 34.2% |
| 11 | Nicole T. Lee | 2.8% | 31.1% |
| 12 | Julia M. Ramirez | 3.0% | 29.2% |
| 13 | Marty Quinn | 1.1% | 25.0% |
| 14 | Jeylu B. Gutierrez | 2.6% | 31.4% |
| 15 | Raymond Lopez | 3.9% | 33.8% |
| 16 | Stephanie D. Coleman | 4.2% | 39.9% |
| 17 | David Moore | 4.0% | 41.6% |
| 18 | Derrick G. Curtis | 1.3% | 30.0% |
| 19 | Matthew J. O’Shea | 1.0% | 22.7% |
| 20 | Jeanette B. Taylor | 6.6% | 40.2% |
| 21 | Ronnie L. Mosley | 2.2% | 39.1% |
| 22 | Michael D. Rodriguez | 3.9% | 37.4% |
| 23 | Silvana Tabares | 1.2% | 22.5% |
| 24 | Monique L. Scott | 4.9% | 39.4% |
| 25 | Byron Sigcho Lopez | 3.8% | 31.0% |
| 26 | Jessica Fuentes | 5.0% | 30.7% |
| 27 | Walter Redmond Burnett | 4.4% | 27.0% |
| 28 | Jason C. Ervin | 5.6% | 39.3% |
| 29 | Chris Taliaferro | 5.3% | 36.4% |
| 30 | Ruth Cruz | 3.9% | 25.2% |
| 31 | Felix Cardona, Jr. | 4.9% | 32.2% |
| 32 | Scott Waguespack | 2.4% | 13.6% |
| 33 | Rossana Rodriguez Sanchez | 4.3% | 26.6% |
| 34 | William Conway | 2.4% | 17.8% |
| 35 | Anthony Quezada | 4.6% | 26.0% |
| 36 | Gilbert Villegas | 3.8% | 27.6% |
| 37 | Emma Mitts | 6.6% | 37.3% |
| 38 | Nicholas Sposato | 2.2% | 23.6% |
| 39 | Samantha Nugent | 3.5% | 25.2% |
| 40 | Andre Vasquez, Jr. | 4.6% | 26.5% |
| 41 | Anthony Napolitano | 1.9% | 20.2% |
| 42 | Brendan Reilly | 2.5% | 21.8% |
| 43 | Timmy Knudsen | 4.1% | 21.4% |
| 44 | Bennett R. Lawson | 4.5% | 20.1% |
| 45 | James M. Gardiner | 2.7% | 20.5% |
| 46 | Angela Clay | 6.3% | 29.0% |
| 47 | Matthew J. Martin | 4.3% | 14.4% |
| 48 | Leni Manaa-Hoppenworth | 7.0% | 32.6% |
| 49 | Maria E. Hadden | 6.8% | 29.4% |
| 50 | Debra Silverstein | 4.3% | 31.3% |
Footnotes
We calculate neighborhood-level AC access from Census data using the same geographic aggregation methodology described for ward-level statistics on the Civic Data Atlas methodology page.↩︎