| Ward | Alder | % of ward land area in disadvantaged areas | % of jobs in ward located in disadvantaged areas | % of ward residents working in Chicago whose job is in a disadvantaged area |
|---|---|---|---|---|
| 1 | Daniel La Spata | 0% | 0% | 4.9% |
| 2 | Brian Hopkins | 0% | 0% | 3.5% |
| 3 | Pat Dowell | 40.4% | 15.0% | 9.9% |
| 4 | Lamont J. Robinson | 27.8% | 5.1% | 9.6% |
| 5 | Desmon C. Yancy | 40.2% | 2.9% | 9.9% |
| 6 | William E. Hall | 62.6% | 60.9% | 18.6% |
| 7 | Gregory Mitchell | 72.0% | 63.6% | 18.5% |
| 8 | Michelle Harris | 12.1% | 6.6% | 16.3% |
| 9 | Anthony Beale | 62.6% | 81.3% | 19.5% |
| 10 | Peter Chico | 64.6% | 82.7% | 24.0% |
| 11 | Nicole T. Lee | 21.7% | 28.0% | 18.2% |
| 12 | Julia M. Ramirez | 46.9% | 35.2% | 18.5% |
| 13 | Marty Quinn | 6.6% | 2.7% | 14.7% |
| 14 | Jeylu B. Gutierrez | 54.3% | 33.9% | 19.6% |
| 15 | Raymond Lopez | 82.1% | 37.4% | 19.6% |
| 16 | Stephanie D. Coleman | 100.0% | 100.0% | 20.3% |
| 17 | David Moore | 88.3% | 93.1% | 20.1% |
| 18 | Derrick G. Curtis | 9.2% | 5.2% | 17.6% |
| 19 | Matthew J. O’Shea | 0.4% | 0% | 11.0% |
| 20 | Jeanette B. Taylor | 84.0% | 68.3% | 15.2% |
| 21 | Ronnie L. Mosley | 20.9% | 21.3% | 17.4% |
| 22 | Michael D. Rodriguez | 83.4% | 86.3% | 22.3% |
| 23 | Silvana Tabares | 11.7% | 10.2% | 16.2% |
| 24 | Monique L. Scott | 92.4% | 91.0% | 19.3% |
| 25 | Byron Sigcho Lopez | 26.9% | 9.9% | 12.0% |
| 26 | Jessica Fuentes | 14.4% | 20.5% | 9.2% |
| 27 | Walter Redmond Burnett | 36.0% | 22.0% | 8.3% |
| 28 | Jason C. Ervin | 73.4% | 52.9% | 16.5% |
| 29 | Chris Taliaferro | 57.8% | 58.1% | 15.1% |
| 30 | Ruth Cruz | 0% | 0% | 6.3% |
| 31 | Felix Cardona, Jr. | 8.8% | 12.0% | 9.0% |
| 32 | Scott Waguespack | 0% | 0% | 4.3% |
| 33 | Rossana Rodriguez Sanchez | 0% | 0% | 5.6% |
| 34 | William Conway | 2.0% | 0.2% | 5.2% |
| 35 | Anthony Quezada | 3.9% | 3.6% | 6.2% |
| 36 | Gilbert Villegas | 11.3% | 10.0% | 7.8% |
| 37 | Emma Mitts | 82.5% | 96.3% | 16.0% |
| 38 | Nicholas Sposato | 0% | 0% | 6.0% |
| 39 | Samantha Nugent | 0% | 0% | 5.7% |
| 40 | Andre Vasquez, Jr. | 8.9% | 4.7% | 4.6% |
| 41 | Anthony Napolitano | 0% | 0% | 5.0% |
| 42 | Brendan Reilly | 0% | 0% | 3.0% |
| 43 | Timmy Knudsen | 0% | 0% | 3.1% |
| 44 | Bennett R. Lawson | 0% | 0% | 3.2% |
| 45 | James M. Gardiner | 0% | 0% | 5.8% |
| 46 | Angela Clay | 3.1% | 3.1% | 3.5% |
| 47 | Matthew J. Martin | 0% | 0% | 3.8% |
| 48 | Leni Manaa-Hoppenworth | 0% | 0% | 3.8% |
| 49 | Maria E. Hadden | 4.1% | 2.0% | 4.4% |
| 50 | Debra Silverstein | 8.9% | 13.1% | 6.6% |
Who Would Mayor Johnson’s Head Tax Rebate Reach?
Summary
- The mayor's latest head tax proposal would rebate the full value of the head tax for jobs in socioeconomically disadvantaged areas. We estimate that 9% of private-sector jobs in Chicago would qualify, concentrated in wards on the South and West Sides.
- Over 80% of Chicago workers who live in a disadvantaged area work outside one, where the rebate does not apply. Even in wards where most jobs are exempt, fewer than 25% of residents who work in Chicago have jobs in disadvantaged areas.
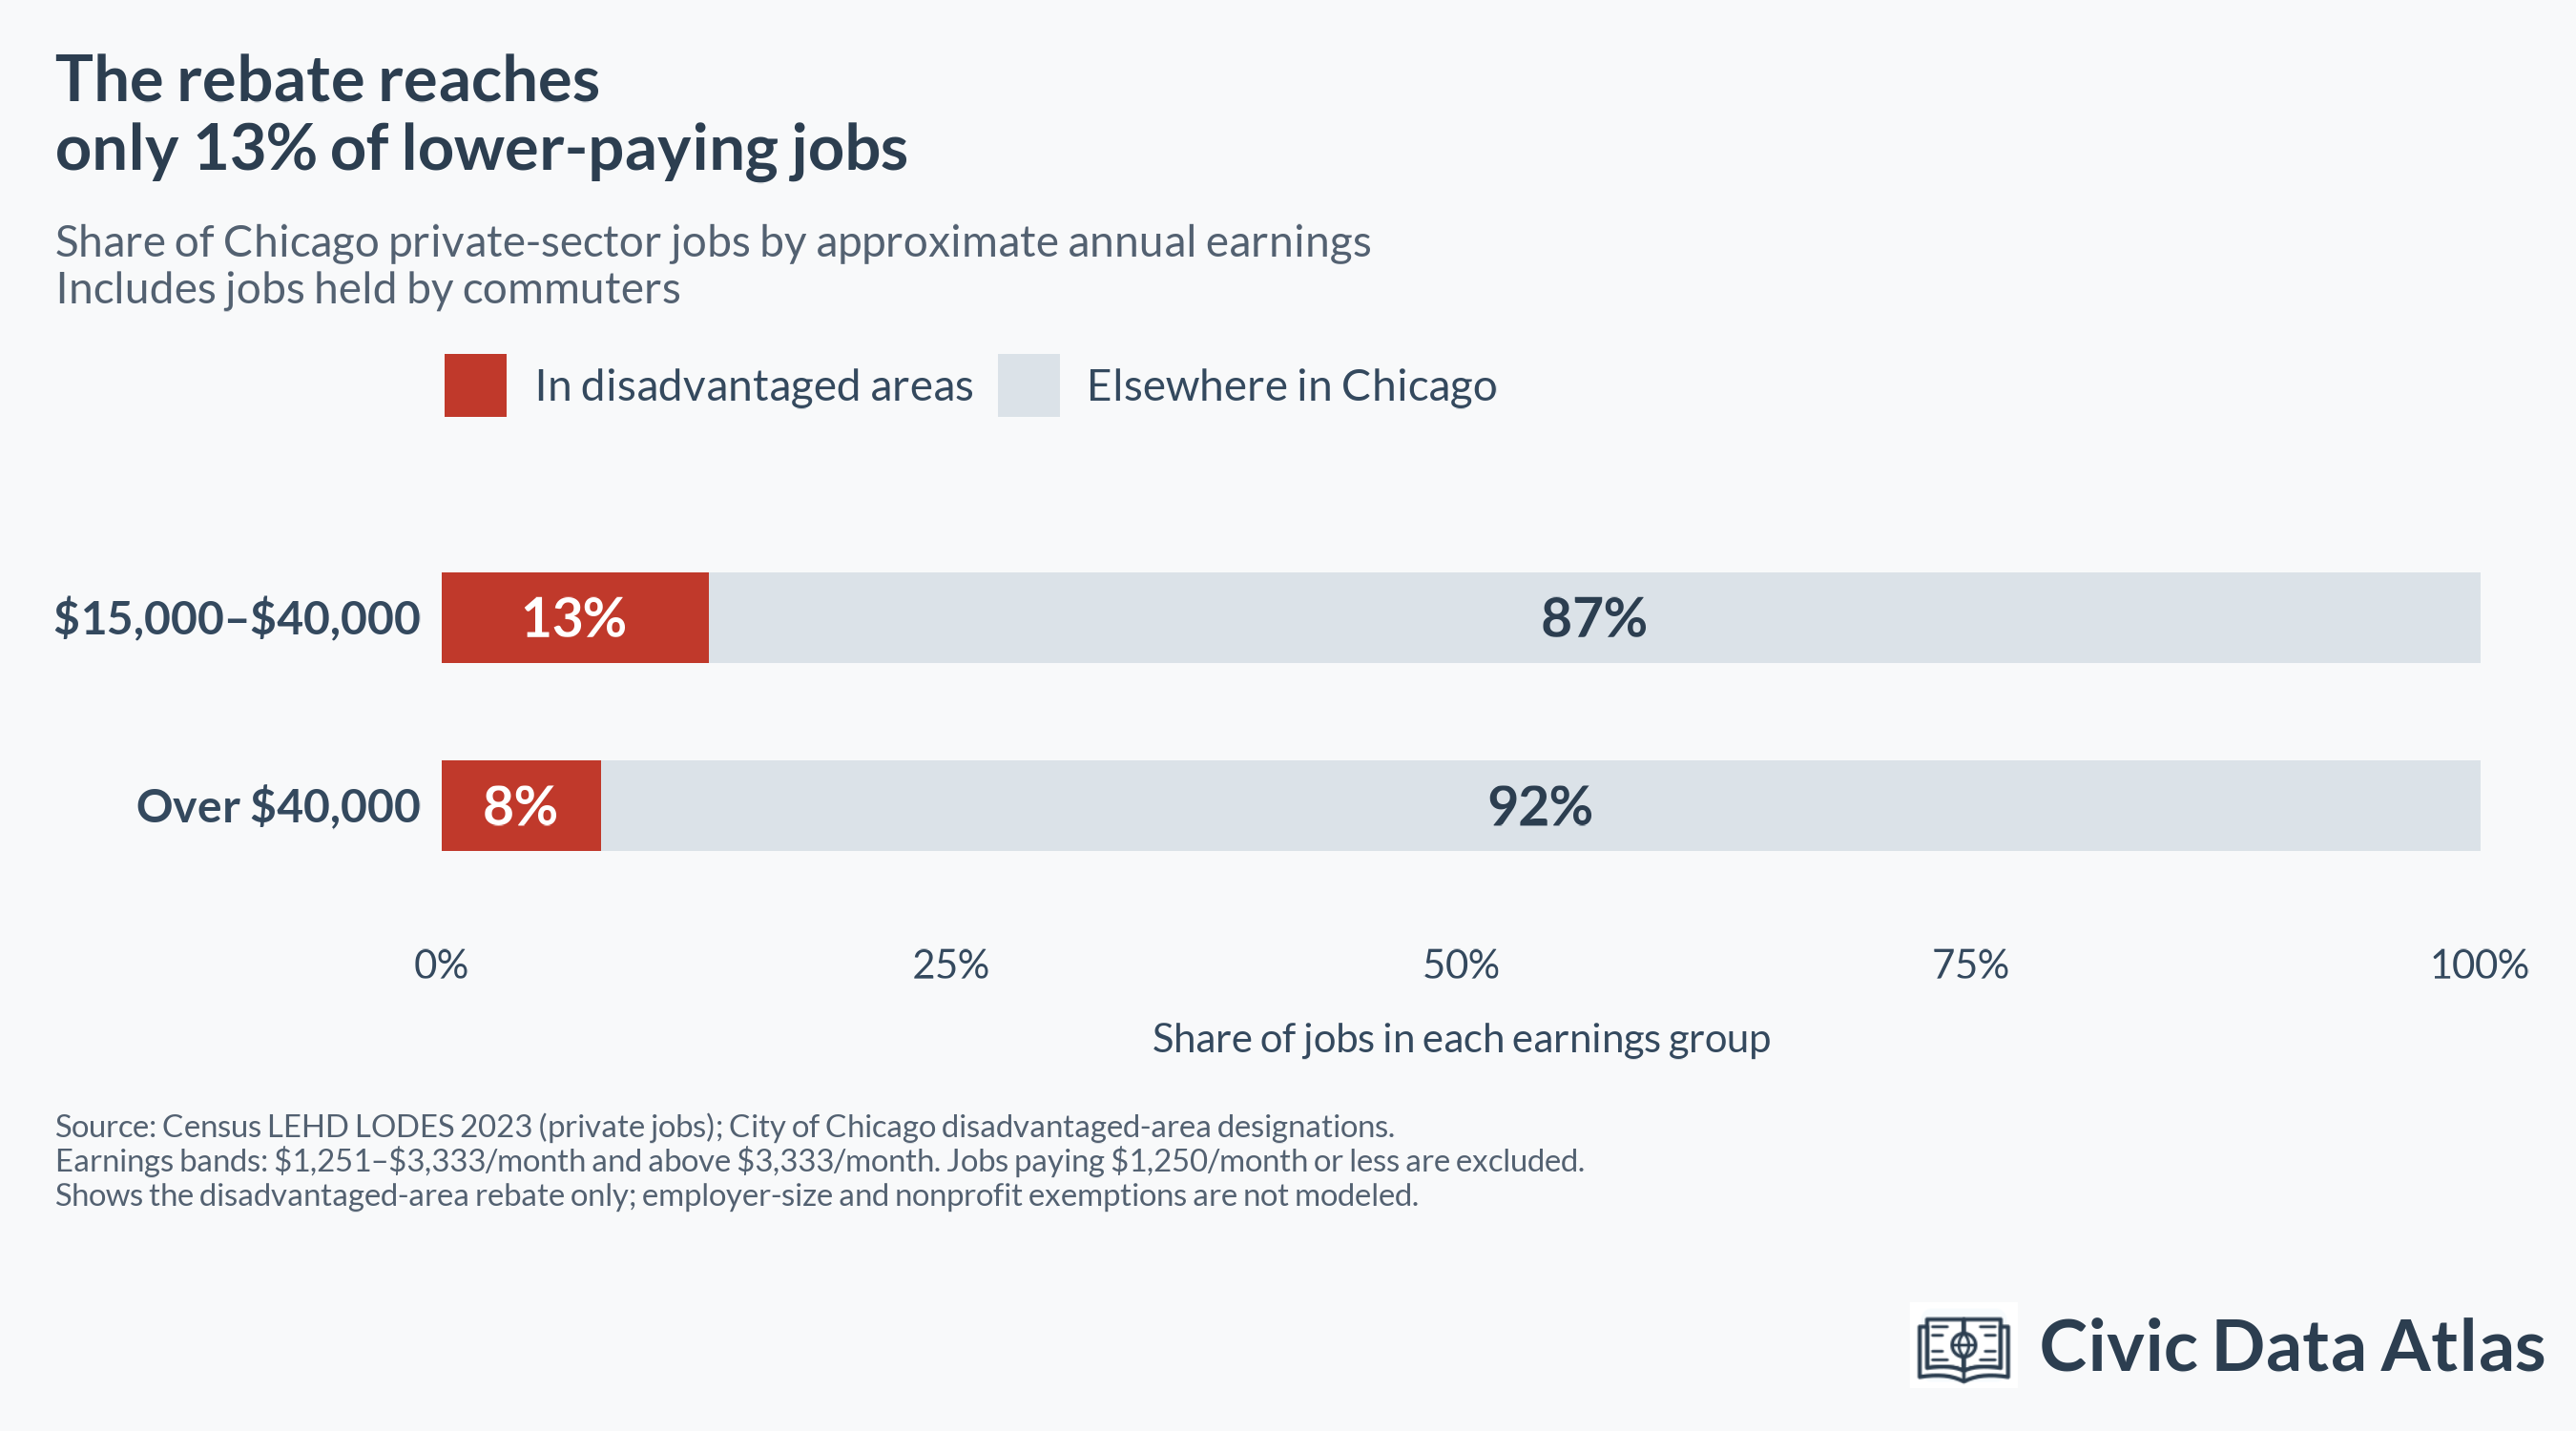
- Jobs in disadvantaged areas are more likely to be lower-paid, but because few jobs are in disadvantaged areas, the rebate covers just 13% of jobs paying $15,000–$40,000 a year.
Chicago Mayor Brandon Johnson has proposed a modified version of a “head tax” for the 2027 budget. Officially named the “equitable employer tax,” it would charge large employers $25 per month for each qualifying employee working in Chicago. Last year, the City Council rejected a similar head tax amid concerns that it would discourage hiring and push employers out of the city.
This year’s proposal adds a rebate: firms would receive a full rebate for any employee working in a socioeconomically disadvantaged area, effectively exempting those jobs from the tax.1
This report analyzes the impact of the rebate using the Census Bureau’s Origin-Destination Employment Statistics, which tracks both employees’ home addresses and their work locations. The analysis does not account for all the other reasons employees could be exempt from the tax: some employees who work outside disadvantaged areas could qualify for an exemption on other grounds, and some employees in disadvantaged areas would be exempt even without the rebate. The methodological details at the end of the report explain the data and its caveats in more detail.
Where the rebate would apply
We estimate that 9% of private-sector jobs located in Chicago are in disadvantaged areas. For comparison, the proposed budget sets aside funding for the rebate equivalent to 10.5% of projected head tax revenue.2
The map below shows the locations of disadvantaged areas, as well as the fraction of jobs in each ward that are exempt.
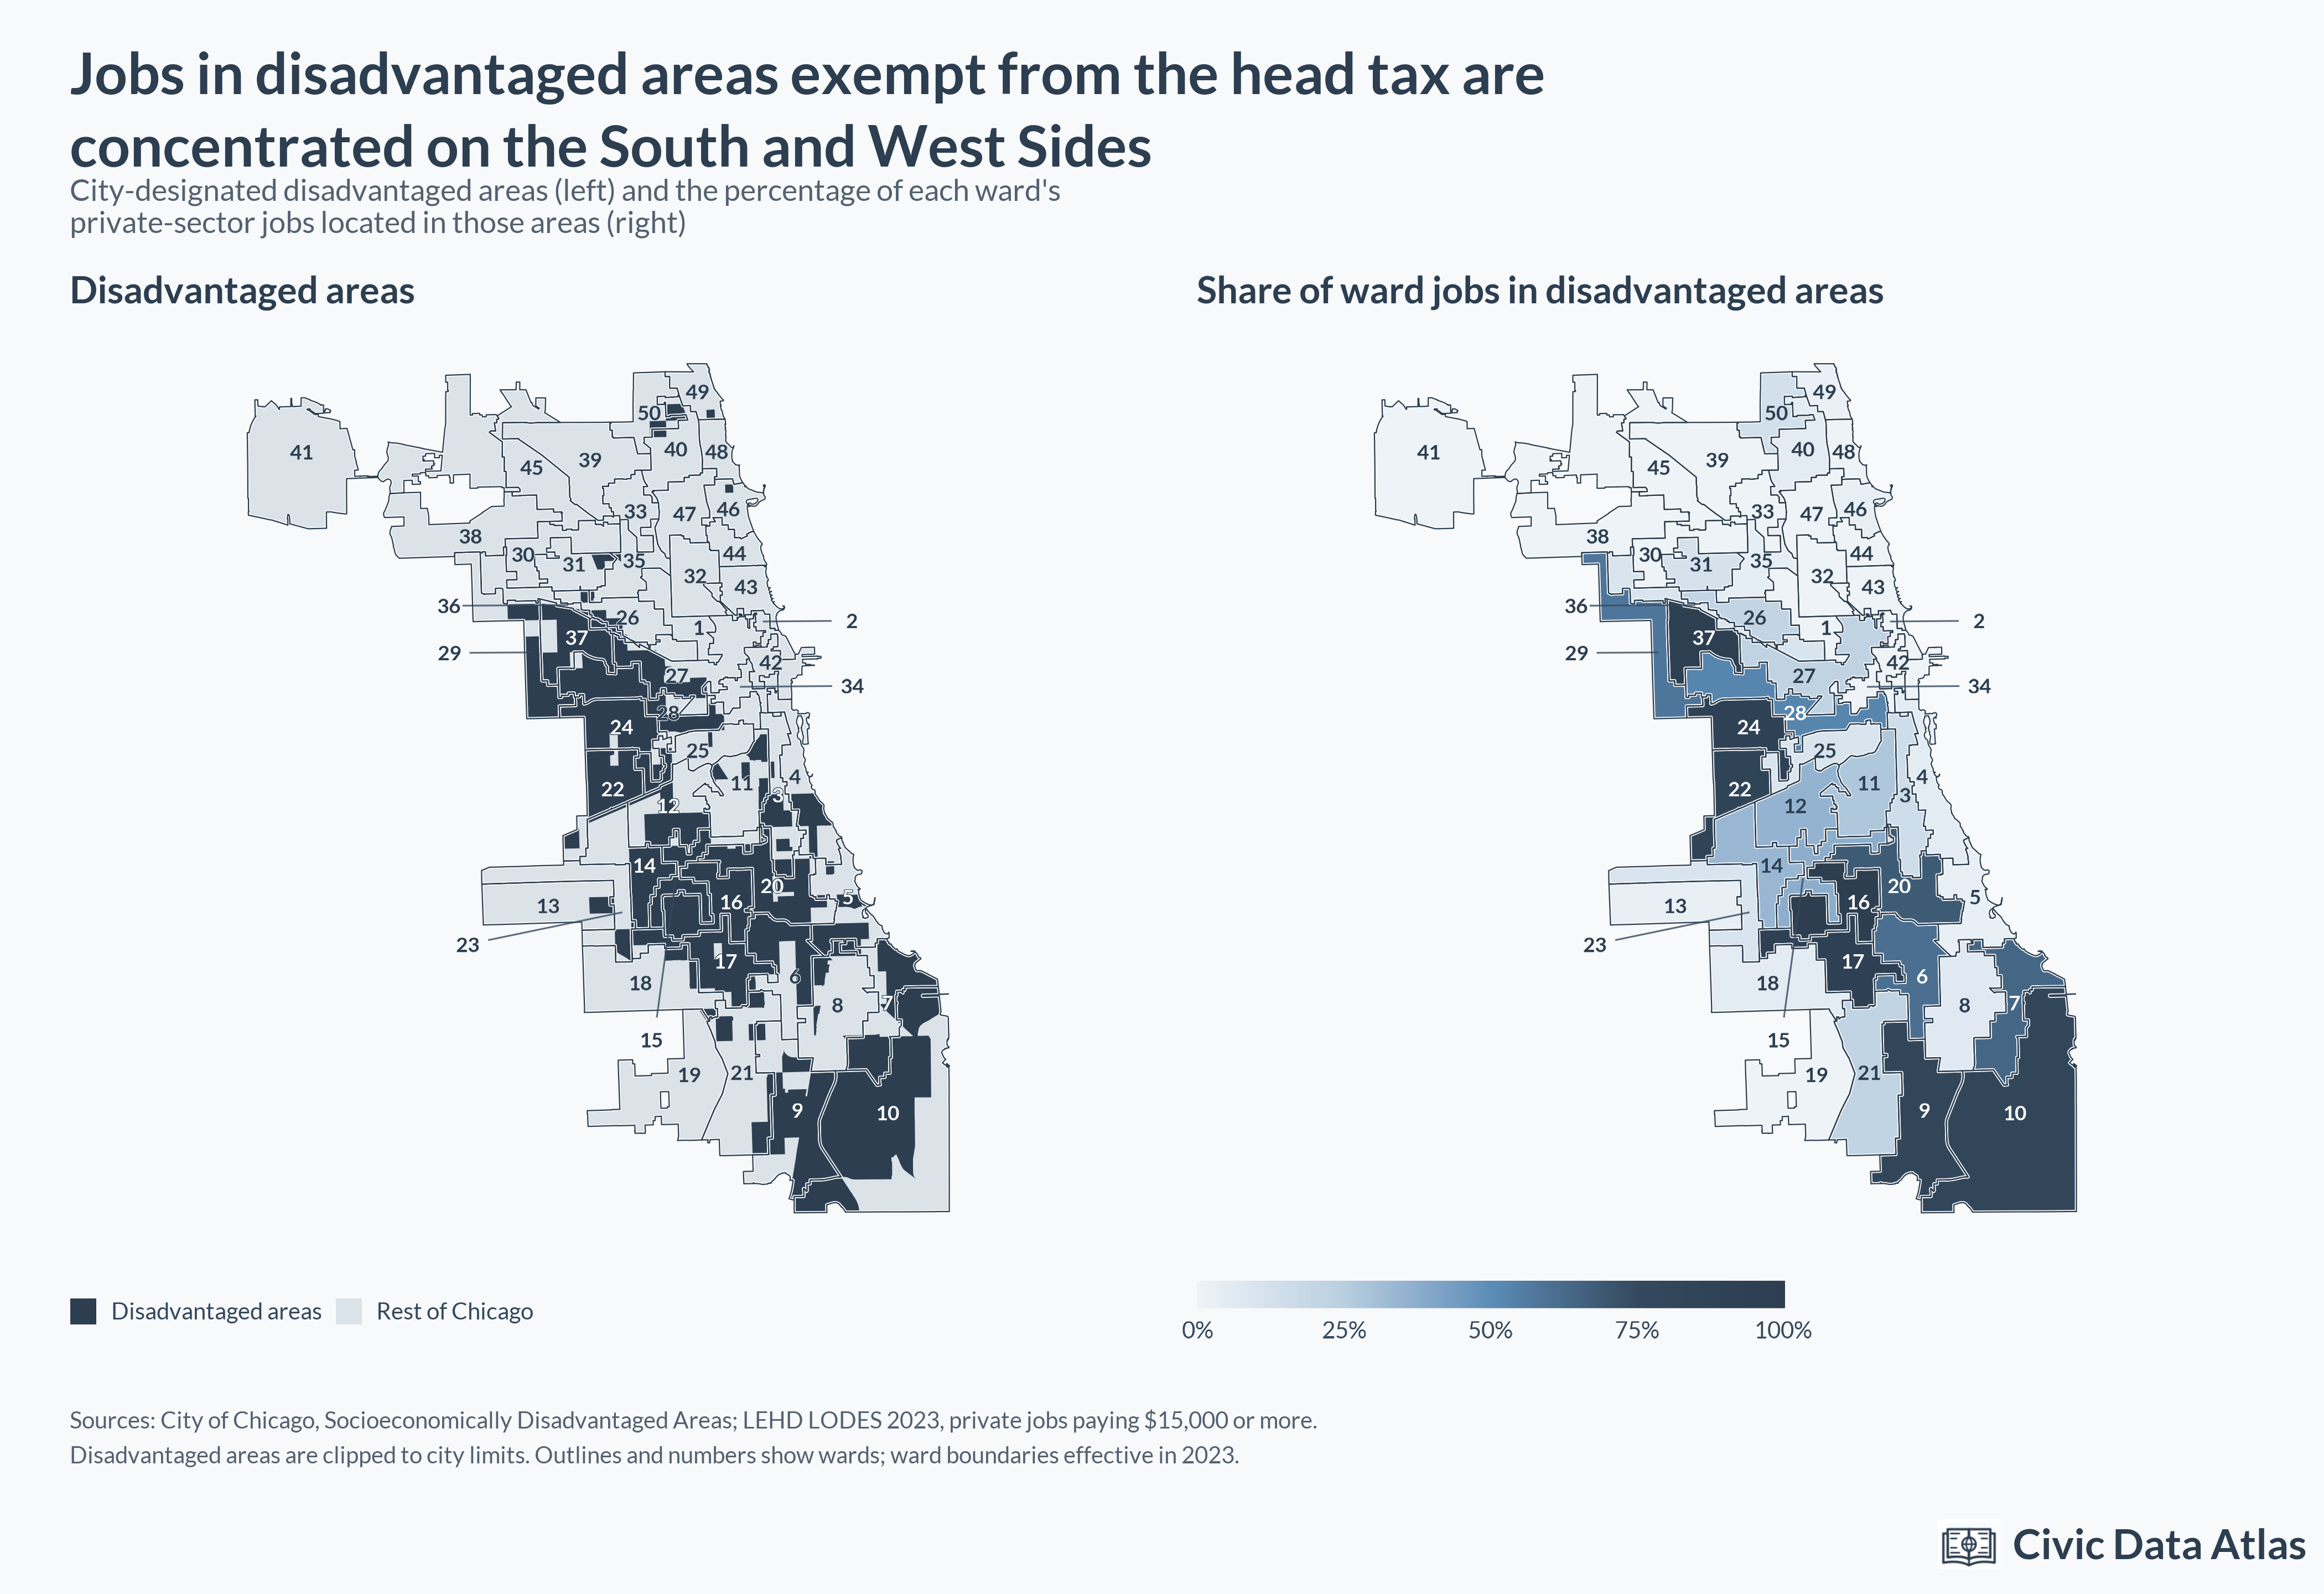
The rebate exempts most jobs in wards on the South and West Sides. Elsewhere, the rebate barely applies: 14 wards have no jobs that qualify for the rebate, and in another 20, fewer than a quarter do.
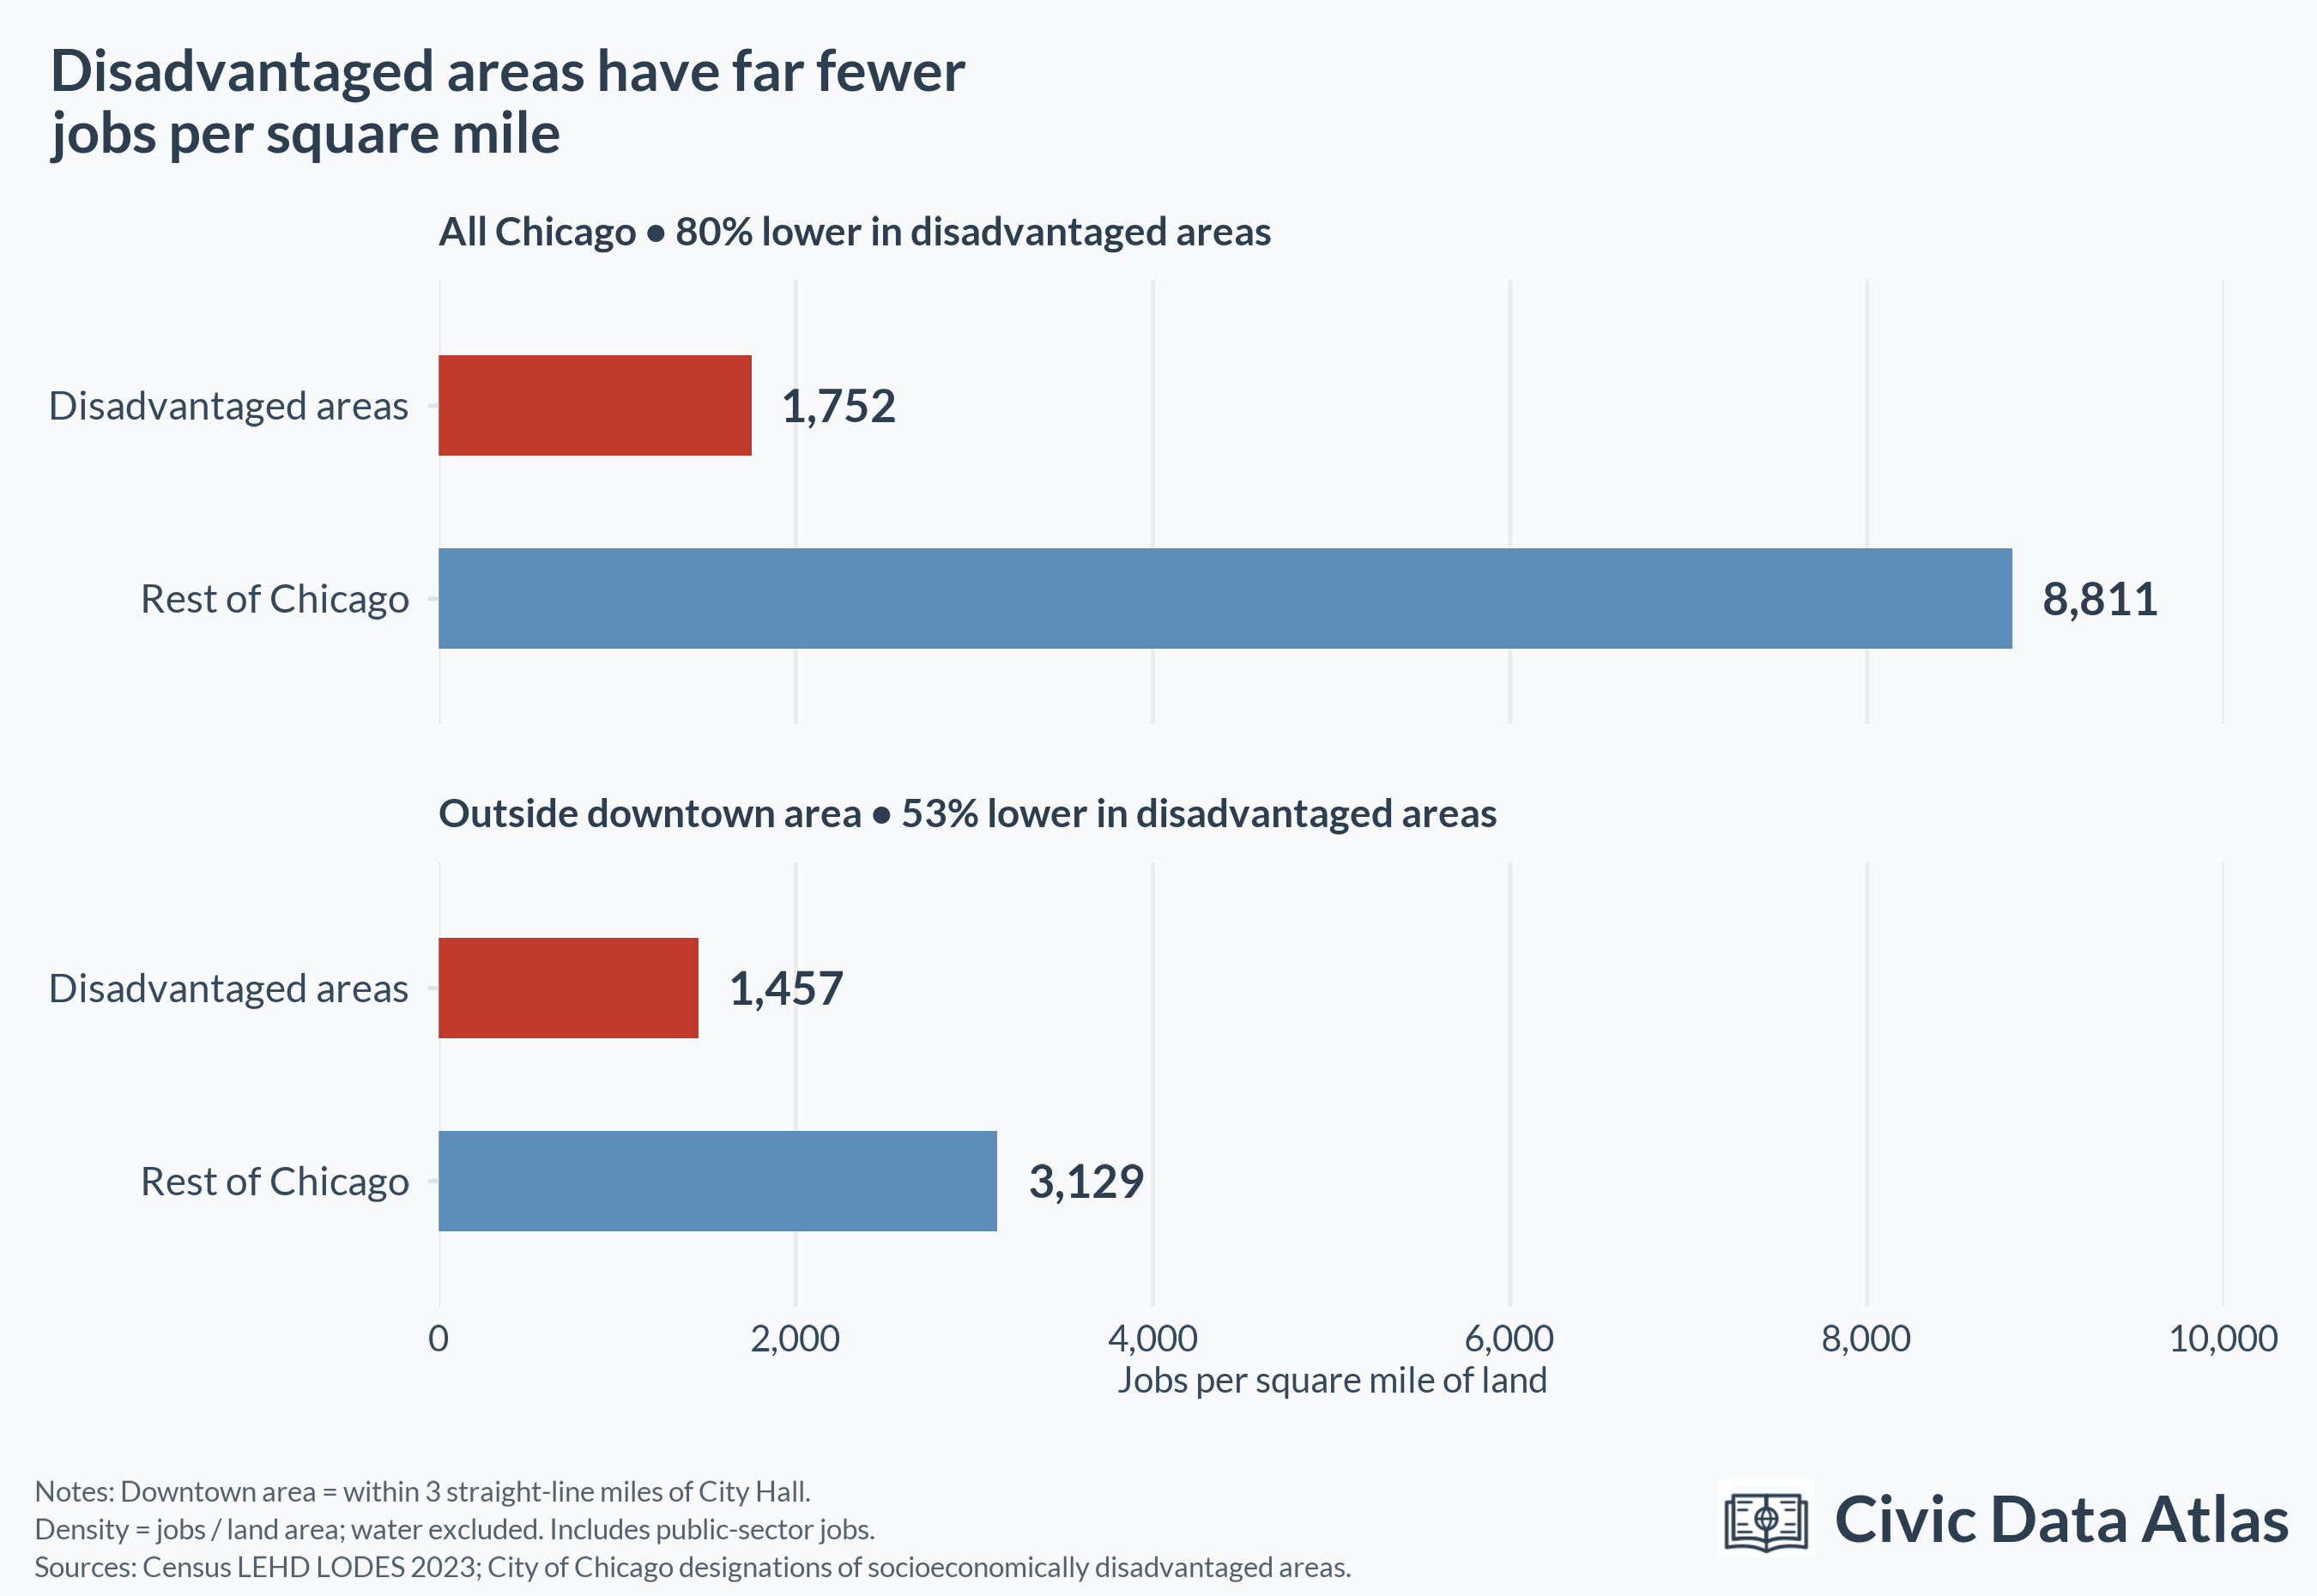
Disadvantaged areas have higher rates of poverty, lower household incomes, lower educational attainment, and higher unemployment (these are the metrics that go into the city’s definition of disadvantaged areas). They also have far lower job density than the rest of the city, which is consistent with Mayor Johnson’s argument that these neighborhoods need more employers.
Where residents of disadvantaged areas work
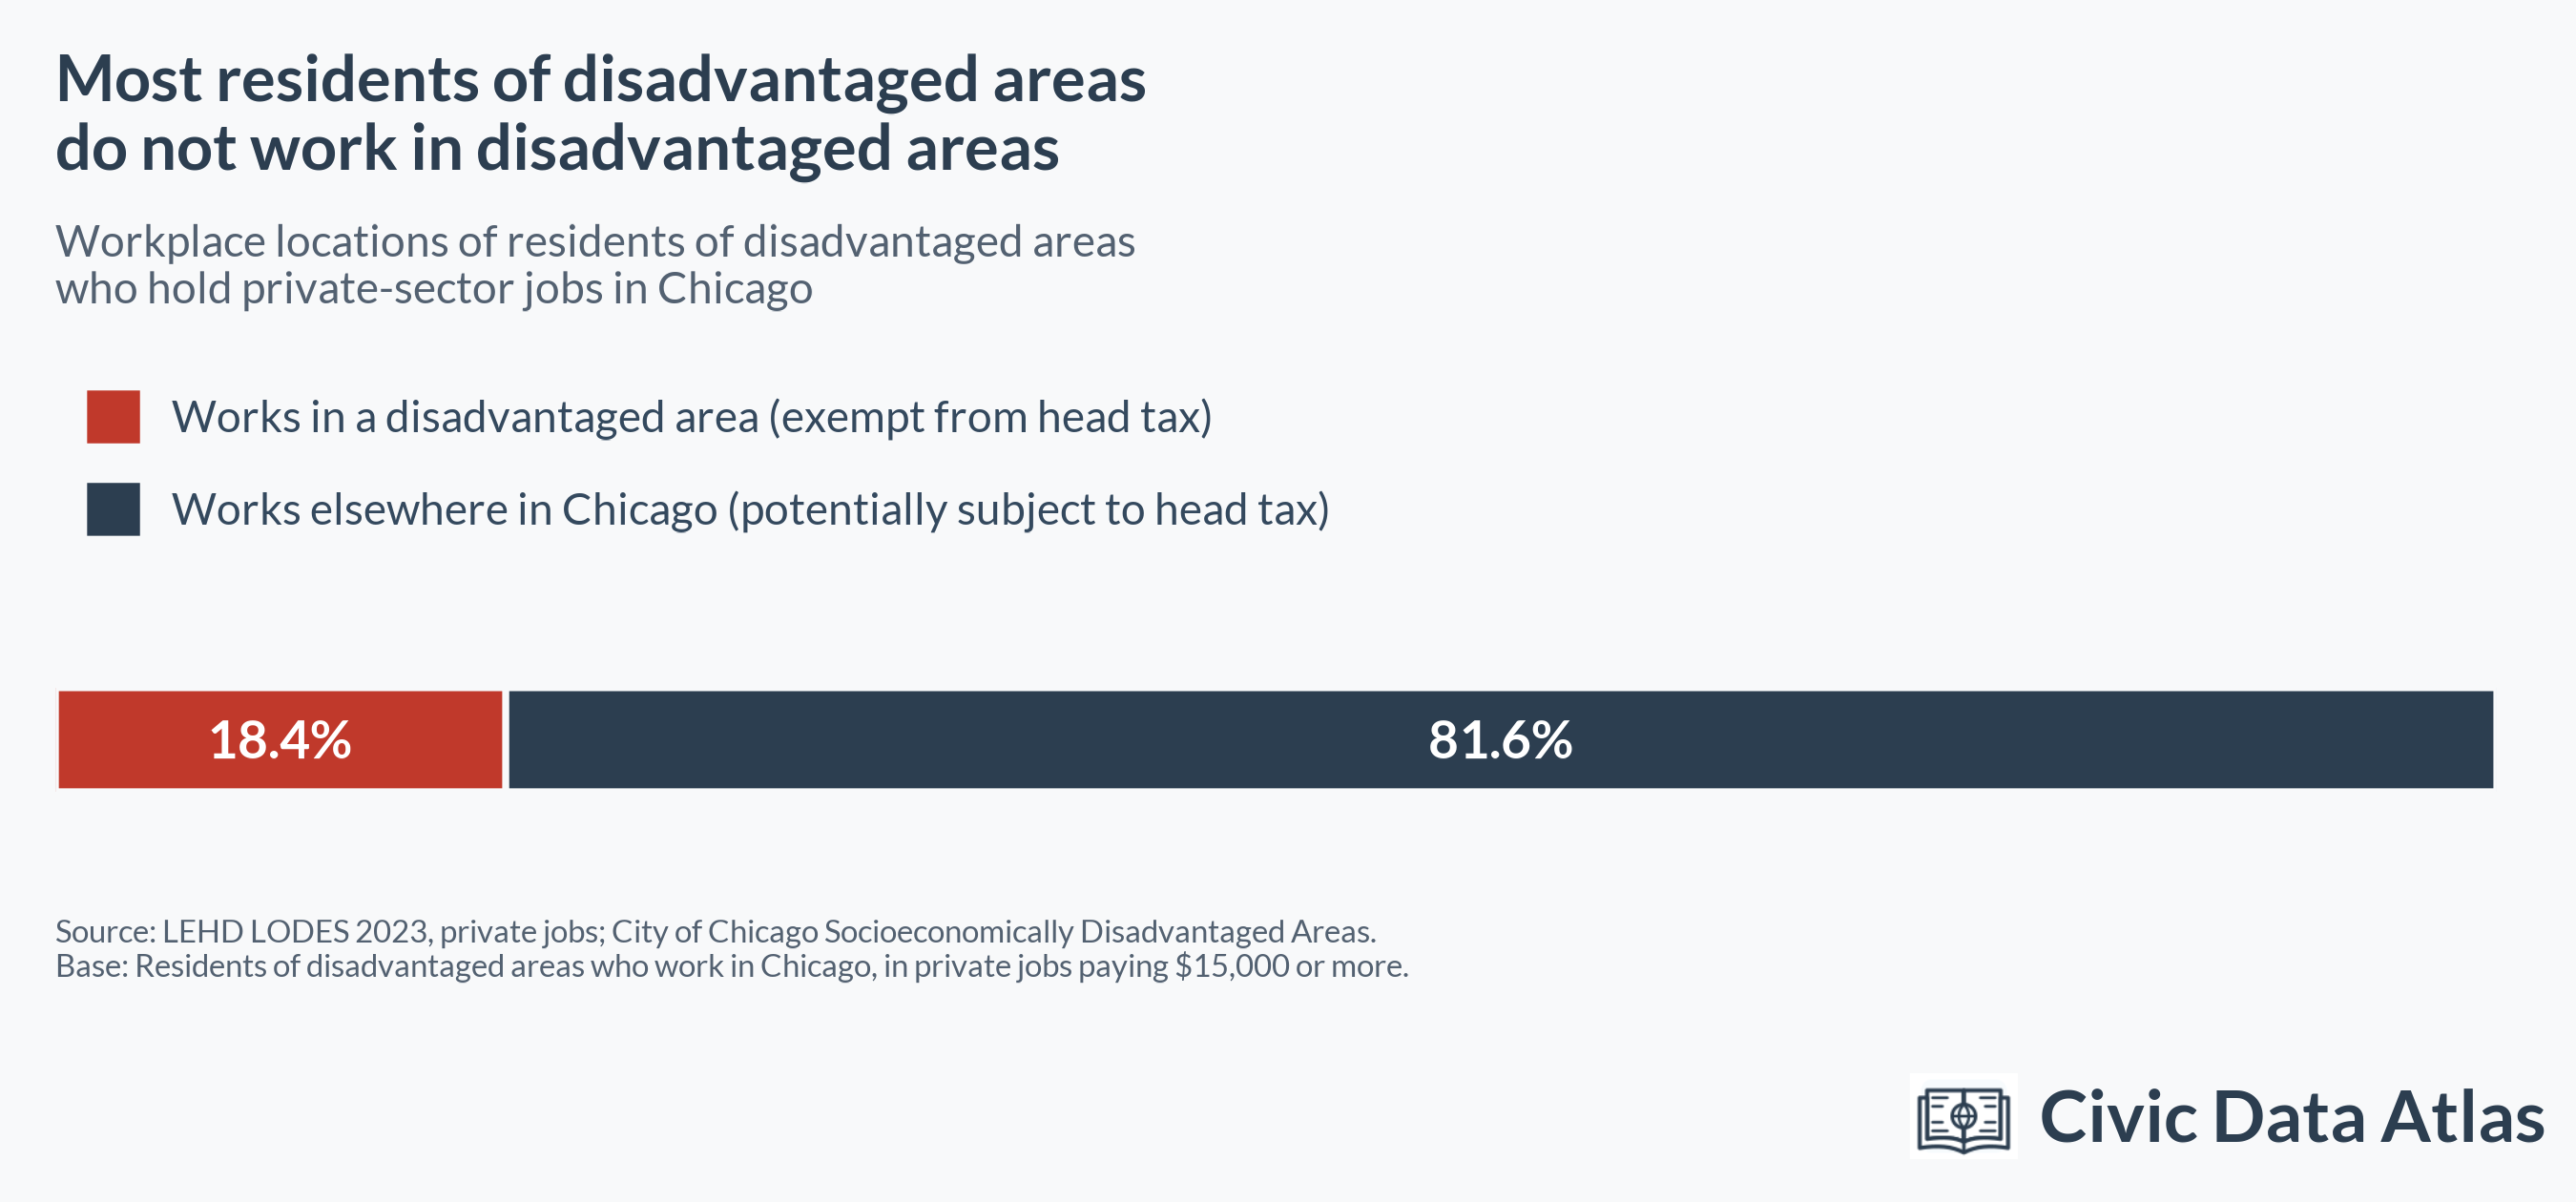
Among residents of disadvantaged areas with private-sector jobs in Chicago, 82% work elsewhere in the city. As a result, if alders are concerned that workers ultimately bear the tax burden, exempting local jobs within their wards will do little to protect most of their constituents.
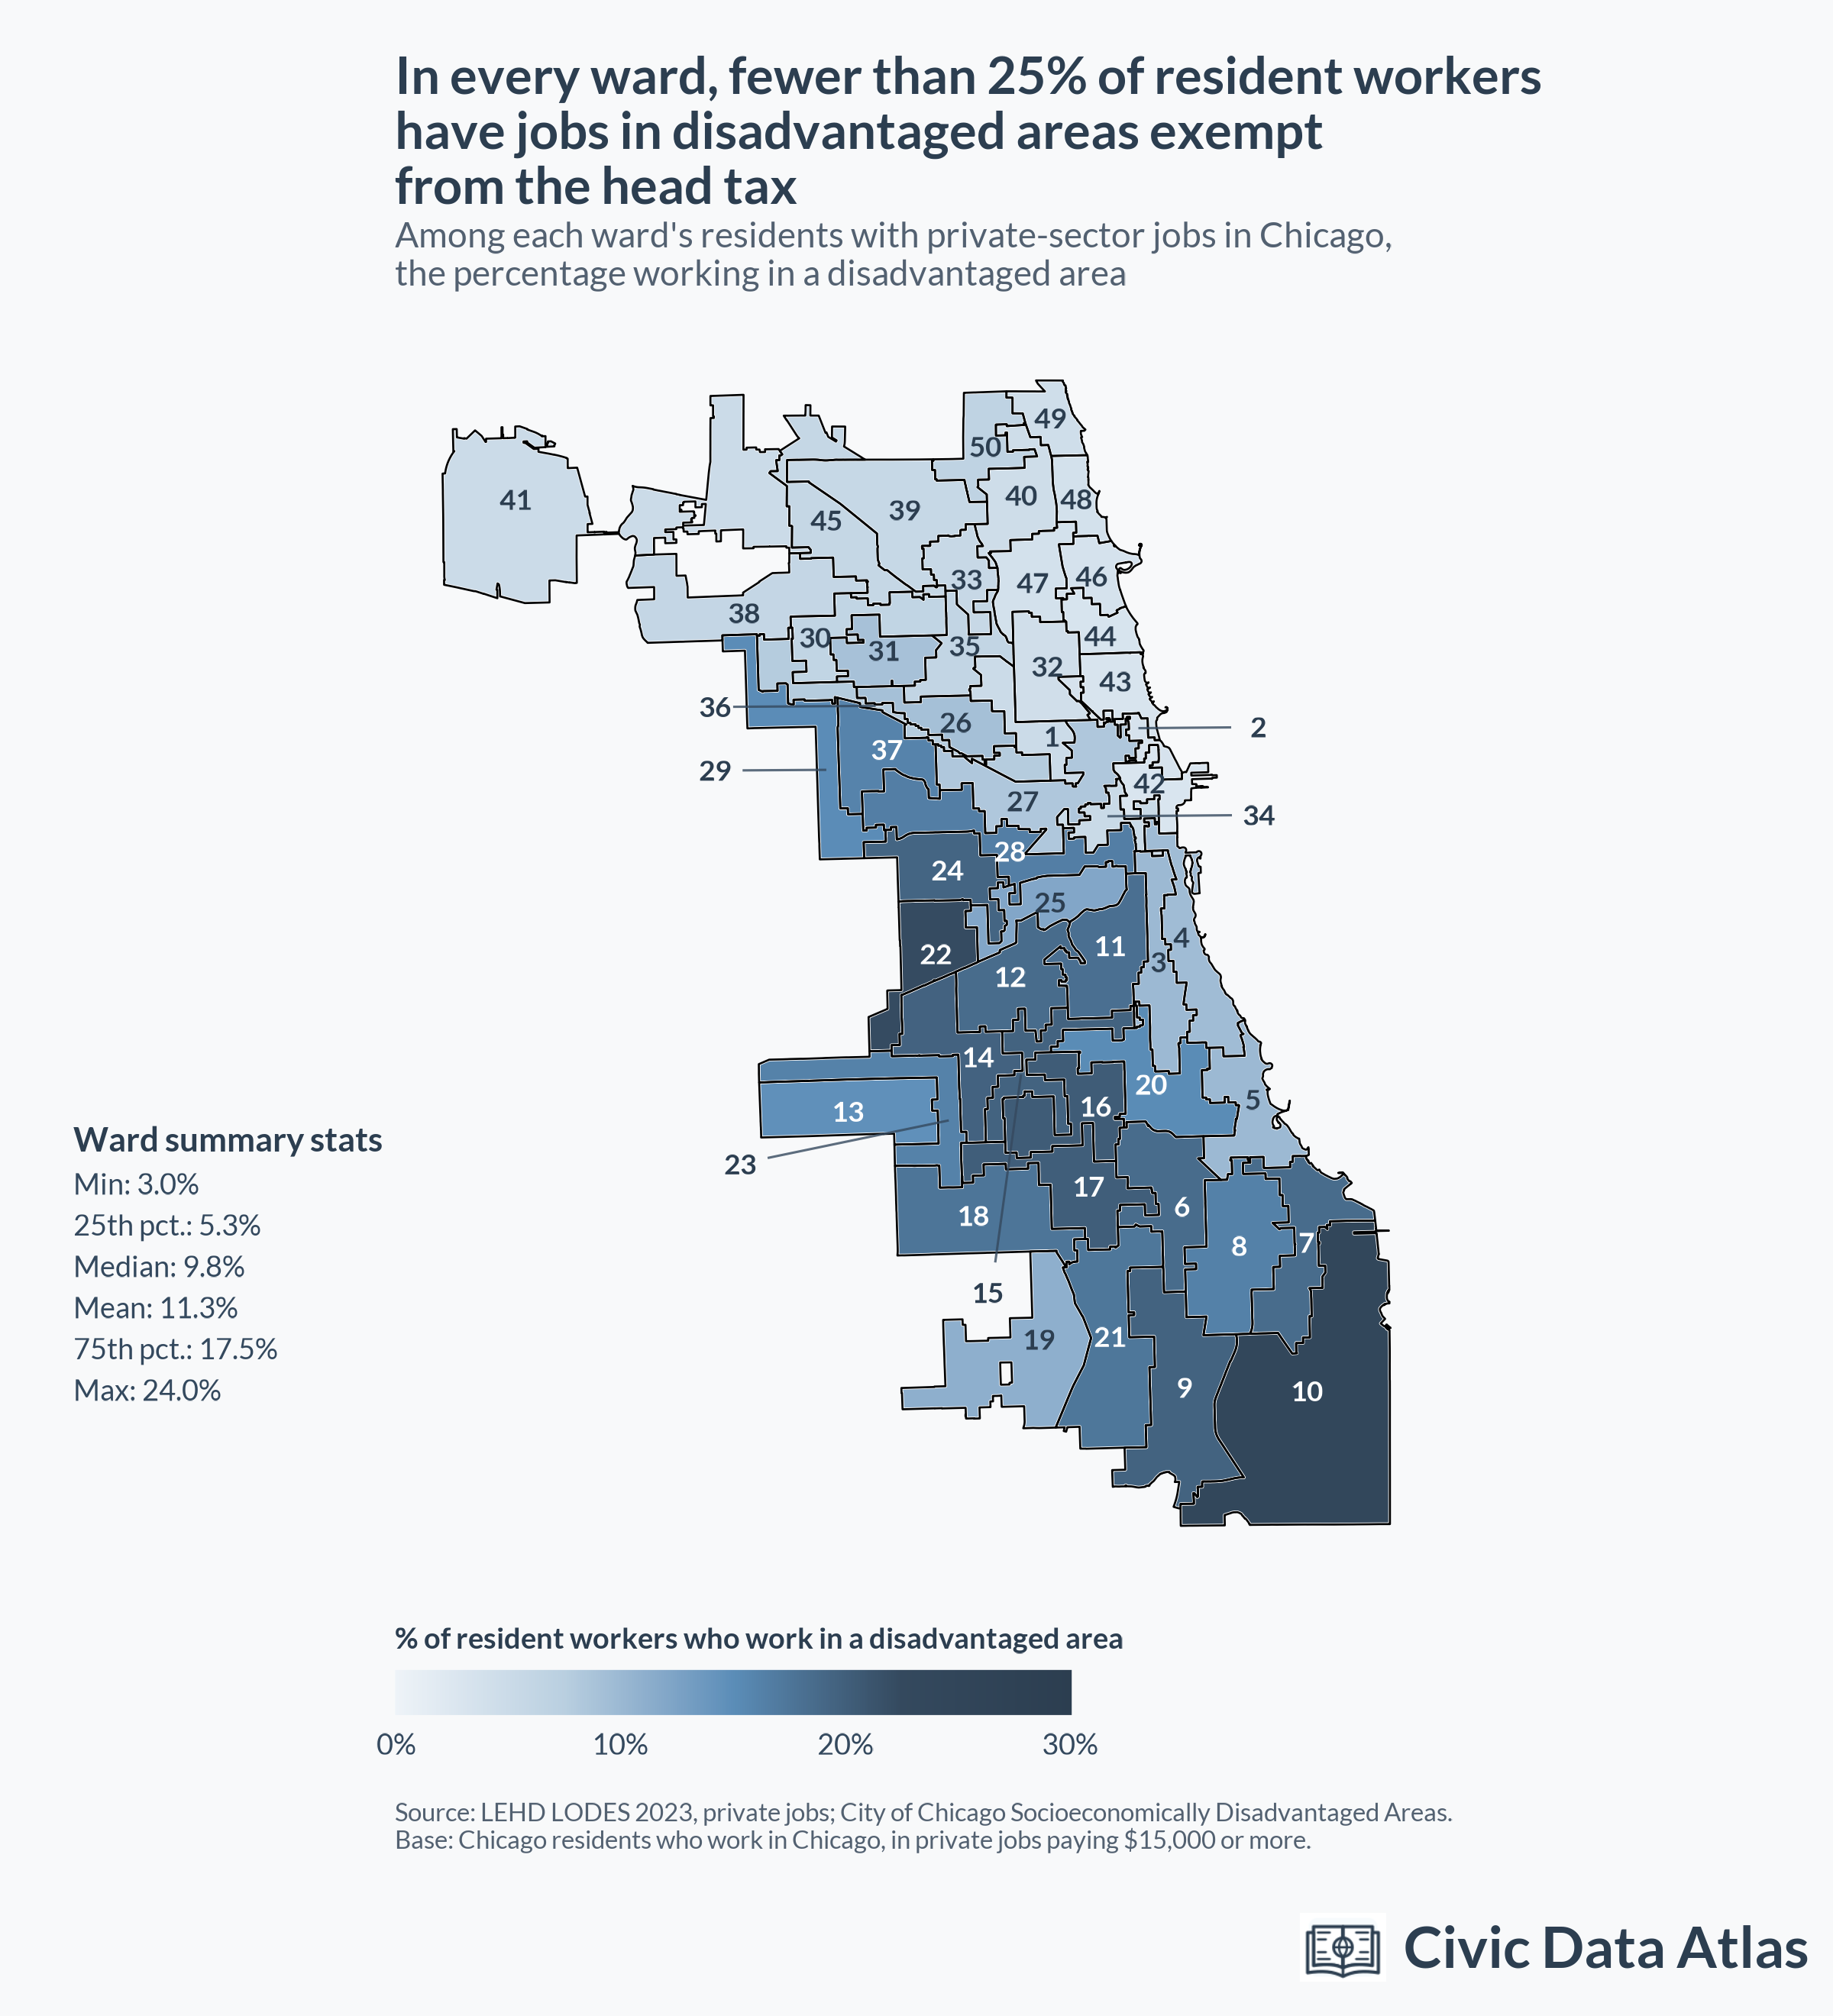
Even in wards where most jobs are in disadvantaged areas, fewer than 25% of ward residents who work in Chicago work in a disadvantaged area.3 Conversely, every ward has some residents who work in a disadvantaged area, even wards with none inside their boundaries.
How earnings differ inside and outside disadvantaged areas
How well does the rebate target lower-paying jobs? The data sorts jobs only into broad earnings bands, so we treat jobs paying $15,000 to $40,000 a year as lower-paying. Jobs paying less than about $15,000 mostly fall below the tax’s earnings threshold and are excluded from the analysis. Based on the available data, the rebate is targeted toward lower-earning jobs. Among jobs in disadvantaged areas, 36% pay between $15,000 and $40,000 per year, compared with 24% in the rest of Chicago.
While the rebate is disproportionately concentrated among lower-paying jobs, it reaches only a small fraction of them overall. Just 13% of Chicago jobs paying $15,000 to $40,000 annually are located in a disadvantaged area.
Evaluating the head tax rebate
Evaluating the impact of the head tax rebate depends on how you view the head tax itself.
Supporters who see the tax as a modest fee on large, profitable corporations can reasonably view the rebate as an economic development lever that steers jobs toward disadvantaged areas. This matches how Mayor Johnson has framed the rebate. In his address to the City Council, he called it an “incentive” that allows “concerned employers to avoid the tax entirely if they bring their business to the communities that need development and access to jobs the most.”4
Critics concerned that a head tax ultimately hurts lower-income workers will find little reassurance in the rebate. Although jobs in disadvantaged areas skew lower-paying, 87% of Chicago jobs paying $15,000 to $40,000 are still located outside disadvantaged areas. Of course, many of those low-income workers may work for small employers or nonprofits that are already exempt from the tax (the data is not detailed enough to draw these distinctions). Still, the rebate offers no extra protection for low-income workers beyond the 13% who work in disadvantaged areas, so it does little to answer those who rejected the head tax on these grounds last year.
Finally, for South and West Side alders representing disadvantaged areas, the rebate is a double-edged sword. While it shields local businesses and may create a hiring incentive, it does not protect most of their working constituents who live in these areas: 82% of them commute to jobs outside disadvantaged areas, where the rebate does not apply.
Methodological Details
The head tax provisions cannot be perfectly modeled with Census LODES data. First, the proposal applies to employees earning at least $4,300 from the same employer in a calendar quarter, or about $1,433 per month. The analysis excludes jobs paying $1,250 per month or less to approximate that threshold, but the remaining jobs still include some below it.
Second, the proposal applies only to employers with 125 or more qualifying employees. LODES reports firm size in its workplace data, but not in the home-to-work commuting data used here, so we cannot restrict the commuting analysis to jobs at large employers. According to LODES, 66.1% of private-sector jobs located in Chicago are at firms with at least 250 employees, suggesting most jobs are at firms large enough to owe the tax. That figure errs in both directions. Firm size counts employees nationwide, not just in Chicago, which overstates the share of jobs at firms liable for the tax. Meanwhile, the 250-employee cutoff is higher than the 125-employee threshold (the next category down in the data is 50–249), which understates it.
Third, LODES cannot identify jobs at nonprofit employers, which are exempt from the head tax. According to ACS data, 12% of employed Chicago residents work for a nonprofit. The analysis is restricted to private-sector jobs, which correctly omits government employees, who are also exempt.
Finally, LODES relies on employers to report job-site locations, but some do not report multiple worksites separately. In those cases, the Census Bureau may assign all of an employer’s workers in a state to the employer’s main reported address, which can give erroneous job locations.
Further details about LODES appear on our methodology page, in the Census Bureau’s data documentation, and in its methodology report.
Ward-by-ward estimates
The table below shows, for each ward, the share of its land area in disadvantaged areas, the share of private-sector jobs in the ward located in disadvantaged areas, and the share of ward residents working in Chicago whose jobs are located in disadvantaged areas. Select a column header to sort.
Footnotes
The city has a list of socioeconomically disadvantaged areas based on household income, poverty rate, high school graduation rate, and unemployment rate.↩︎
Specifically, the proposed budget projects $113.8 million in head tax revenue and budgets $12 million for the rebate (listed as SEED credits), equivalent to 10.5% of gross revenue. Our analysis does not account for other reasons workers could be exempt from the head tax, such as working for a small employer or nonprofit, so the numbers are not directly comparable.↩︎
Workers who live in a disadvantaged area but work outside one could still be exempt from the head tax because they work for a small firm or a nonprofit, which LODES cannot capture.↩︎
Critics note that bringing jobs to surrounding Chicago suburbs would also exempt them from the head tax.↩︎